

The Malwarebytes Toolset includes a Crash Dump Analyzer to help make troubleshooting Blue Screen of Death (BSOD) issues fast, easy, and accurate. To utilize the analyzer, go to Inform > History > Blue Screens > Details.
When you launch the Blue Screens Details window (only accessible if the system has crash dumps), you’ll see a list of detected crash dumps from the following locations:
- %WinDir%\MiniDump\*.dmp
- %WinDir%\MEMORY.DMP
This first view aims to give you a quick pre-analysis overview of the following:
- Date– date and time when the crash occurred.
- Bugcheck Code– the actual error code of the BSOD/Bugcheck.
- Description– description of the crash based on the bugcheck/BSOD error code.
- Uptime– total time the operating system had been running for when the crash occurred.
- System State– estimated state the OS was in when the crash may have occurred.
- File Path– Path to the crash dump file.
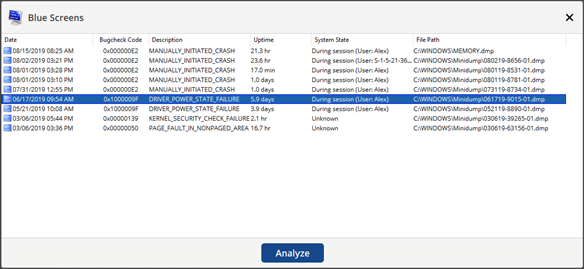
Clicking the Analyze button after selecting a crash dump will call on an integrated portable version of the Debugging Tools for Windows by Microsoft to perform a complete crash dump analysis and output the results in a easy to digest format:
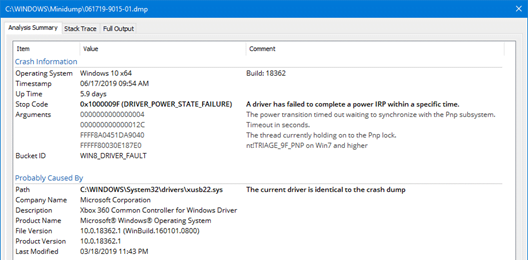
- Analysis Summary – This will give you an overview of the crash dump analysis and highlight key details around the results.
- Crash Information – Operating System (with version, Architecture, and Build), Timestamp, Up Time (of the OS), Stop Code (with error code, error message, and detailed description), Arguments, and Bucket ID.
- Probably Caused By- Path, Company Name, Description, Product Name, File Version, Product Version, Last Modified date, and a Comment if the driver is identical, different, or missing on the system.
- Note: Some fields will not show if the file is missing from or different on the current system.
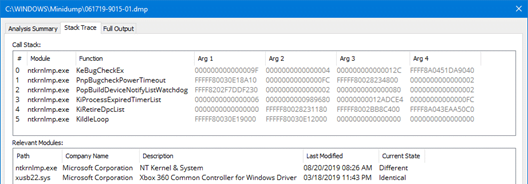
- Stack Trace – This will give you a deeper level of detail around what was happening in the memory stack when the BSOD occurred. This can help identify if there are multiple things at play causing the BSOD.
- Call Stack – the ordered list of modules, their called function, and arguments from when the crash occurred.
- Relevant Modules – list of modules from the Call Stack with details on the Path, Company Name, Description, Last Modified date, and the Current State of the module (e.g. identical, different, or missing).
- Note: Some fields will not show if the file is missing from or different on the current system.
- Full Output – Complete raw text output from WinDBG for manual inspection and additional raw technical details.
- Note: You can highlight, use common keyboard shortcuts, or the right-click context menu to copy content from the Raw Output tab.
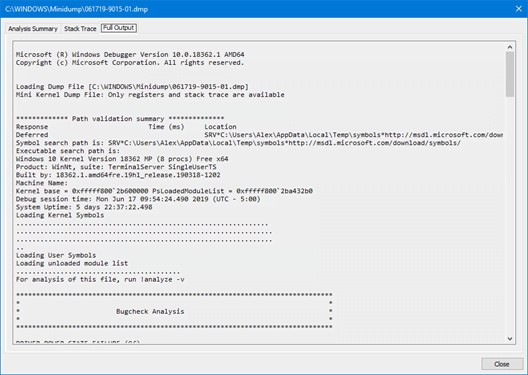
Note: Internet access is required to obtain symbol files from Microsoft to provide an effective and accurate crash dump analysis.
Source : Official Malwarebytes Brand
Editor by : BEST Antivirus KBS Team