The Technical Add-on for Malwarebytes app is a prerequisite for all Malwarebytes apps for Splunk. The app includes Common Information Model (CIM) compliant field extractions and predefined source types for multiple Malwarebytes products making it compatible with all CIM based Splunk apps including Splunk Enterprise Security.
Download Technical Add-on from Splunkbase
- Go to the Technical Add-on for Malwarebytes page in Splunkbase.
- Click on LOGIN TO DOWNLOAD.
- Enter your Splunk user credentials.
Install Technical Add-on for Malwarebytes
Where you install Technical Add-on for Malwarebytes is based on your Splunk environment.
Splunk Enterprise Single Instance Environments
Install the Technical Add-on for Malwarebytes in the same location where the Splunk components, Search Tier, Indexer Tier, and Forwarder Tier are located. For instructions on installing add-on in a single instance environments, refer to Splunk’s support article Install an add-on in a single-instance Splunk Enterprise deployment.
Splunk Enterprise Distributed Environments
Install the Technical Add-on app where your Search Tier, Indexer Tier, and Forwarder Tier are located. For instructions on installing an add-on in a distributed Splunk Enterprise environment, refer to Splunk’s support article Install an add-on in a distributed Splunk Enterprise deployment.
Once the Technical Add-on for Malwarebytes is installed, you can now install the Malwarebytes Visibility and Dashboards app, or Agentless Remediation app for your Splunk environment.
Configure Technical Add-on for Malwarebytes
Once installed, configure the Malwarebytes Technical Add-on app in Splunk.
- In Splunk, click Technical Add-on > Configuration.
- In the Logging tab, set Log level to INFO.
- Click the Add-on Settings tab and enter the following information:
- To get your Cloud Console Account Id:
- Log into the Malwarebytes Nebula platform.
- Copy the following string of characters found in the url.

- In Splunk, paste the characters into the Cloud Console Account Id field.
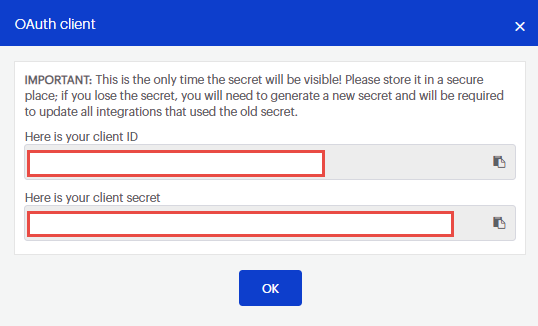
- To get your Cloud Console Client Id and Cloud Console Client Secret:
- Log into the Malwarebytes Nebula platform.
- Go to Settings > APIs & Integrations.
- Click Add, then provide the Application name and select the required access, then Save.
- Copy the generated Client Id.
- In Splunk, paste the Client Id in the Cloud Console Client Id field.
- Return to the Malwarebytes Cloud Console, copy the generated Client Secret.
- In Splunk, paste the Client Secret in the Cloud Console Client Secret field.

- To get your Cloud Console Account Id:
- In the Splunk Username field, enter your Splunk Administrator username.
- In the Splunk Password field, enter your Splunk Administrator password.
- In the Company Name field, enter your company name.
- In the Email field, enter your company email address.
- Click Save.
- In the upper-left corner, click Inputs to configure your modular inputs into Splunk.
Create Inputs for Malwarebytes data
In the upper-left corner, click Inputs to configure your modular inputs into Splunk.
- Click Create New Input > Malwarebytes TA Endpoints Data. Configure this modular input in order to receive data on Endpoints from Malwarebytes Nebula.
- In the Name field, enter a unique name for the modular input.
- In the Interval field, enter an interval time for how often you want Splunk to collect data. To not impact Splunk server performance, we recommend interval times greater than 30 seconds.
- In the Index drop-down, select your preferred index type.
- Click Add.
- Click Create New Input > Malwarebytes TA Detections Data. Configure this modular input in order to receive data on Detections from Malwarebytes Nebula.
- In the Name field, enter a unique name for the modular input.
- In the Interval field, enter an interval time for how often you want Splunk to collect data. To not impact Splunk server performance, we recommend interval times greater than 30 seconds.
- In the Index drop-down, select your preferred index type.
- Click Add.
- Click Create New Input > Malwarebytes TA SA Data. Configure this modular input in order to receive Suspicious Activity data from Malwarebytes Nebula.
- In the Name field, enter a unique name for the modular input.
- In the Interval field, enter an interval time for how often you want Splunk to collect data. To not impact Splunk server performance, we recommend interval times greater than 30 seconds.
- In the Index drop-down, select your preferred index type.
- Click Add.
- Click Create New Input > Malwarebytes TA Audit Data. Configure this modular input in order to receive Audit event data from Malwarebytes Nebula.
- In the Name field, enter a unique name for the modular input.
- In the Interval field, enter an interval time for how often you want Splunk to collect data. To not impact Splunk server performance, we recommend interval times greater than 30 seconds.
- In the Index drop-down, select your preferred index type.
- Click Add.
Malwarebytes modular input action
The Malwarebytes modular input action checks the details stored in Splunk’s internal key-value store. Use these key values to generate technical add-on information for the following sources. Choose the index name based on your previously configured input settings.
- index = “*’ sourcetype=”mwb:ta_sa”
- index = “*’ sourcetype=”mwb:ta_sa_details”
- index = “*’ sourcetype=”mwb:ta_audit”
- index = “*’ sourcetype=”mwb:ta_detections”
- index = “*’ sourcetype=”mwb:ta_endpoints”
Logging details for Malwarebytes Technical Add-on
For Malwarebytes data logs:
- $SPLUNK_HOME/var/log/splunk/ta_malwarebytes_malwarebytes_ta_audit_data.log
- $SPLUNK_HOME/var/log/splunk/ta_malwarebytes_malwarebytes_ta_detections_data.log
- $SPLUNK_HOME/var/log/splunk/ta_malwarebytes_malwarebytes_ta_endpoints_data.log
- $SPLUNK_HOME/var/log/splunk/ta_malwarebytes_malwarebytes_ta_sa_data.log
To setup the Malwarebytes Visibility and Dashboard app for Splunk, see Malwarebytes Visibility and Dashboards app for Splunk and Malwarebytes Nebula.
Source : Official Malwarebytes Brand
Editor by : BEST Antivirus KBS Team

