NOTICE – On August 4 2021, Malwarebytes Endpoint Security reached its End of Life. For more information, see the Malwarebytes Endpoint Security End of Life notice. To upgrade to a supported version of Malwarebytes, see Malwarebytes Endpoint Protection or Malwarebytes for Teams.
The Malwarebytes Visibility and Dashboards app provides custom Splunk searches and dashboards for Malwarebytes endpoint data. This app provides a visual experience for Malwarebytes users. Dashboards have been optimized for fast performance and contain custom drill-downs.
Requirements
To download, install and configure the Malwarebytes Visibility and Dashboards app, you will need:
- An active Splunk Enterprise or Splunk Cloud instance.
- User login credentials for Splunk.
- An active Malwarebytes Endpoint Security subscription.
- Malwarebytes Management Console administrator credentials.
- Technical Add-on for Malwarebytes installed. Refer to Install the Technical Add-on for Malwarebytes for Splunk for more information.
Download Malwarebytes Visibility and Dashboards app
To download the Malwarebytes Visibility and Dashboards app:
- Go to the Malwarebytes Visibility and Dashboards page in Splunkbase.
- Click on LOGIN TO DOWNLOAD. If already logged into Splunkbase, click on DOWNLOAD.
- Enter your Splunk user credentials.
Install Malwarebytes Visibility and Dashboards app
Where you install the Malwarebytes app is based on your Splunk environment.
Splunk Enterprise Single Instance Environments
Install the Malwarebytes Visibility and Dashboards app in the same location where the Splunk components, Search Tier, Indexer Tier, and Forwarder Tier are located. For instructions on installing add-on in a single instance environments, refer to Splunk’s support article Install an add-on in a single-instance Splunk Enterprise deployment.
Splunk Enterprise Distributed Environments
Install the Malwarebytes Visibility and Dashboards app where your Search Tier is located. For instructions on installing an add-on in a distributed Splunk Enterprise environment, refer to Splunk’s support article Install an add-on in a distributed Splunk Enterprise deployment.
Configure Malwarebytes Management Console
Configuration instructions for Malwarebytes Endpoint Security environments.
- Log into your Malwarebytes Management Console as an administrator.
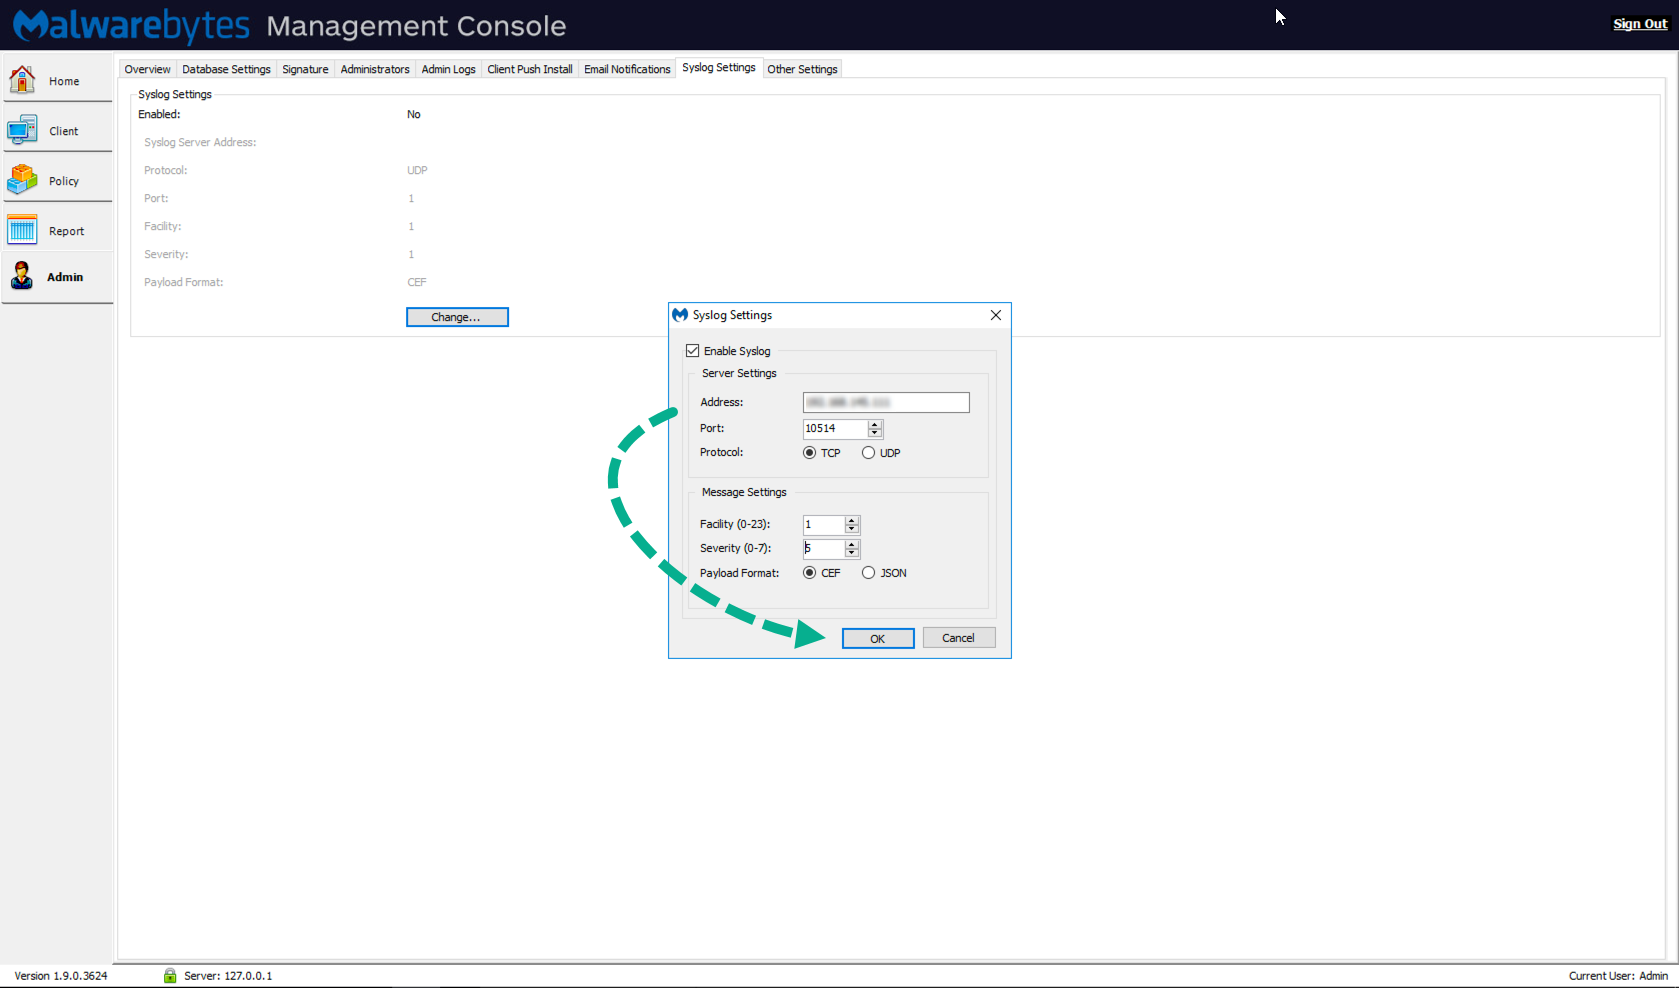
- Go to Admin > Syslog Settings > click Change…
- In the Syslog Settings menu make the following updates:
- In the Address field, enter your Splunk server’s IP address.
- In the Port field, set to 10514.
- For Protocol, set the TCP/UDP as the same as your Splunk server configuration.
- Click OK to save the configuration.
For Malwarebytes Breach Remediation environments, refer to Malwarebytes Agentless Remediation app for Splunk.
Configure Splunk Enterprise
To configure the data inputs for Malwarebytes Breach Remediation or Malwarebytes Endpoint Security, follow the steps below.
- Login to Splunk using administrator credentials and go to Settings > Data Inputs.
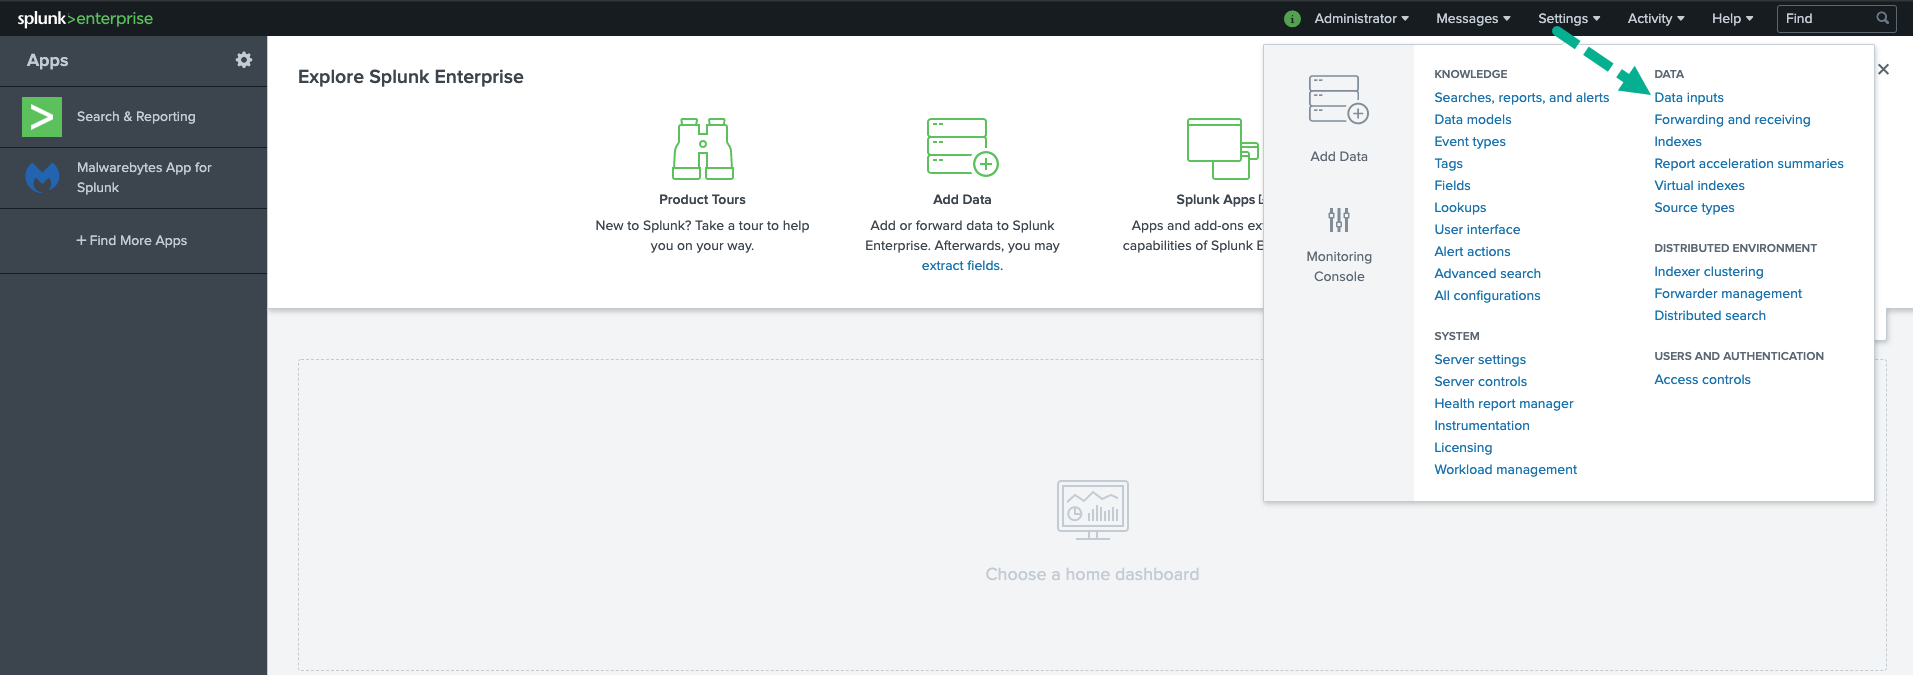
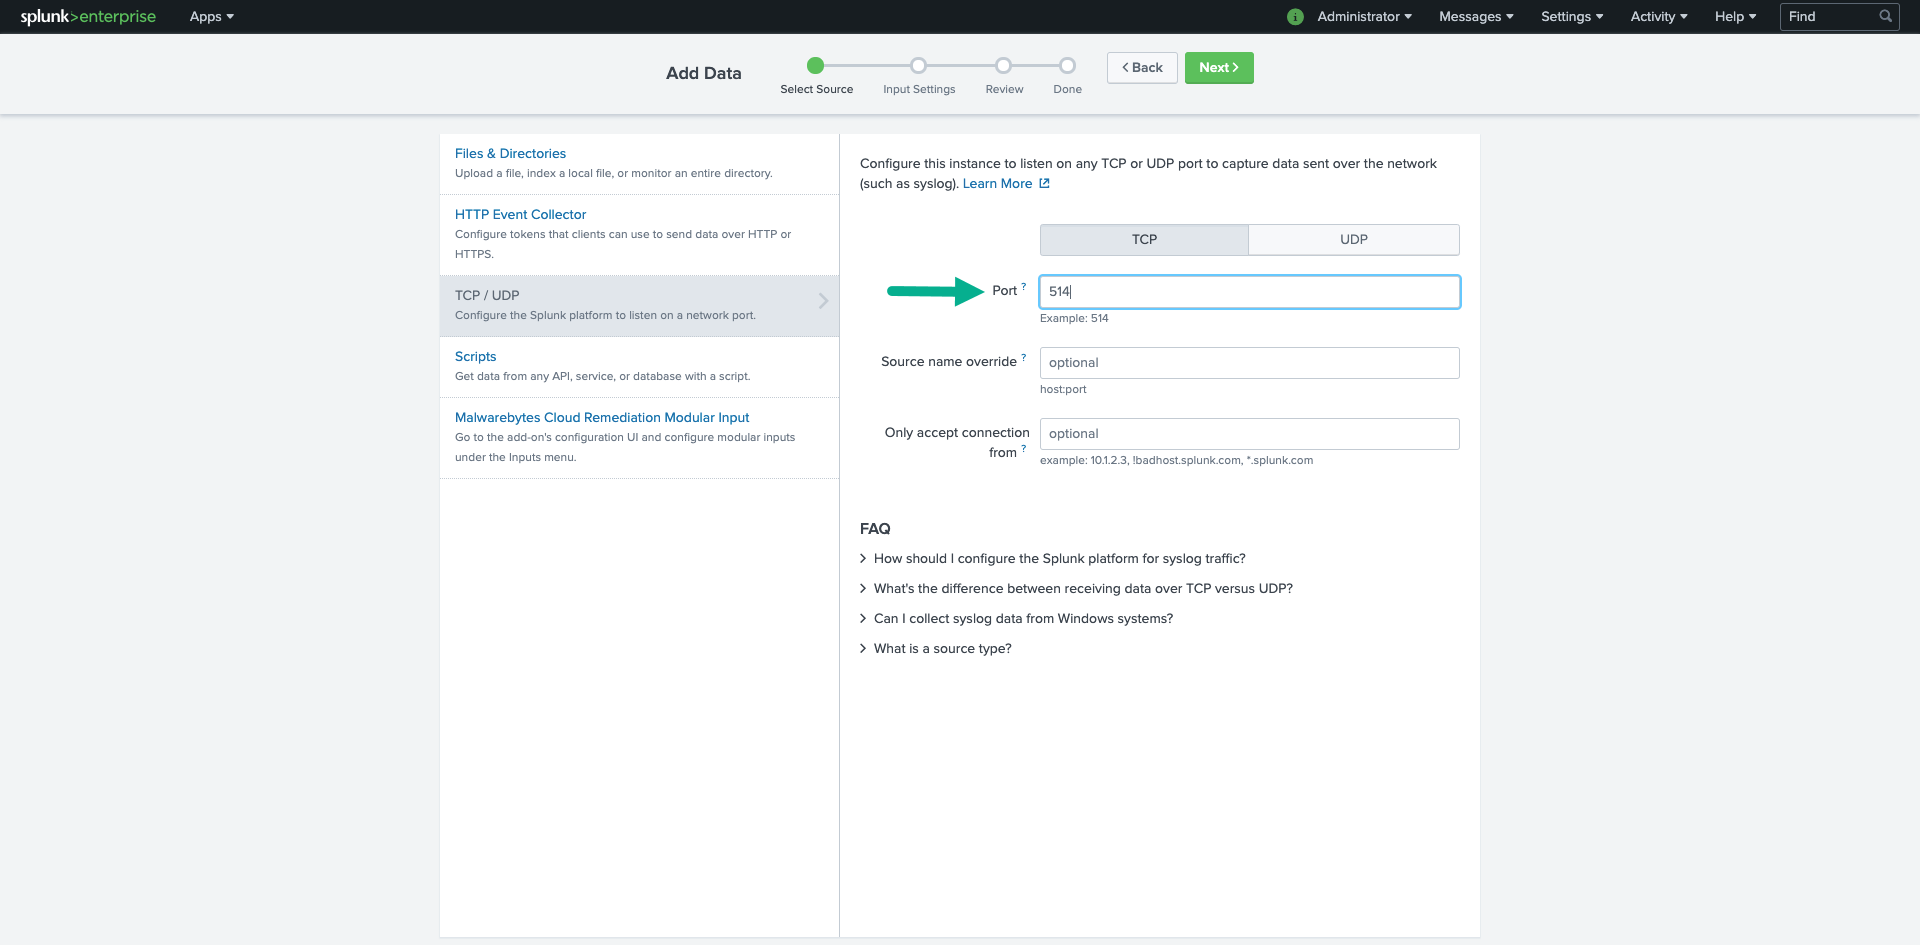
- Under Forwarded Inputs, select either TCP or UDP. Select New.
- Enter 10514 in the Port field. Click Next.
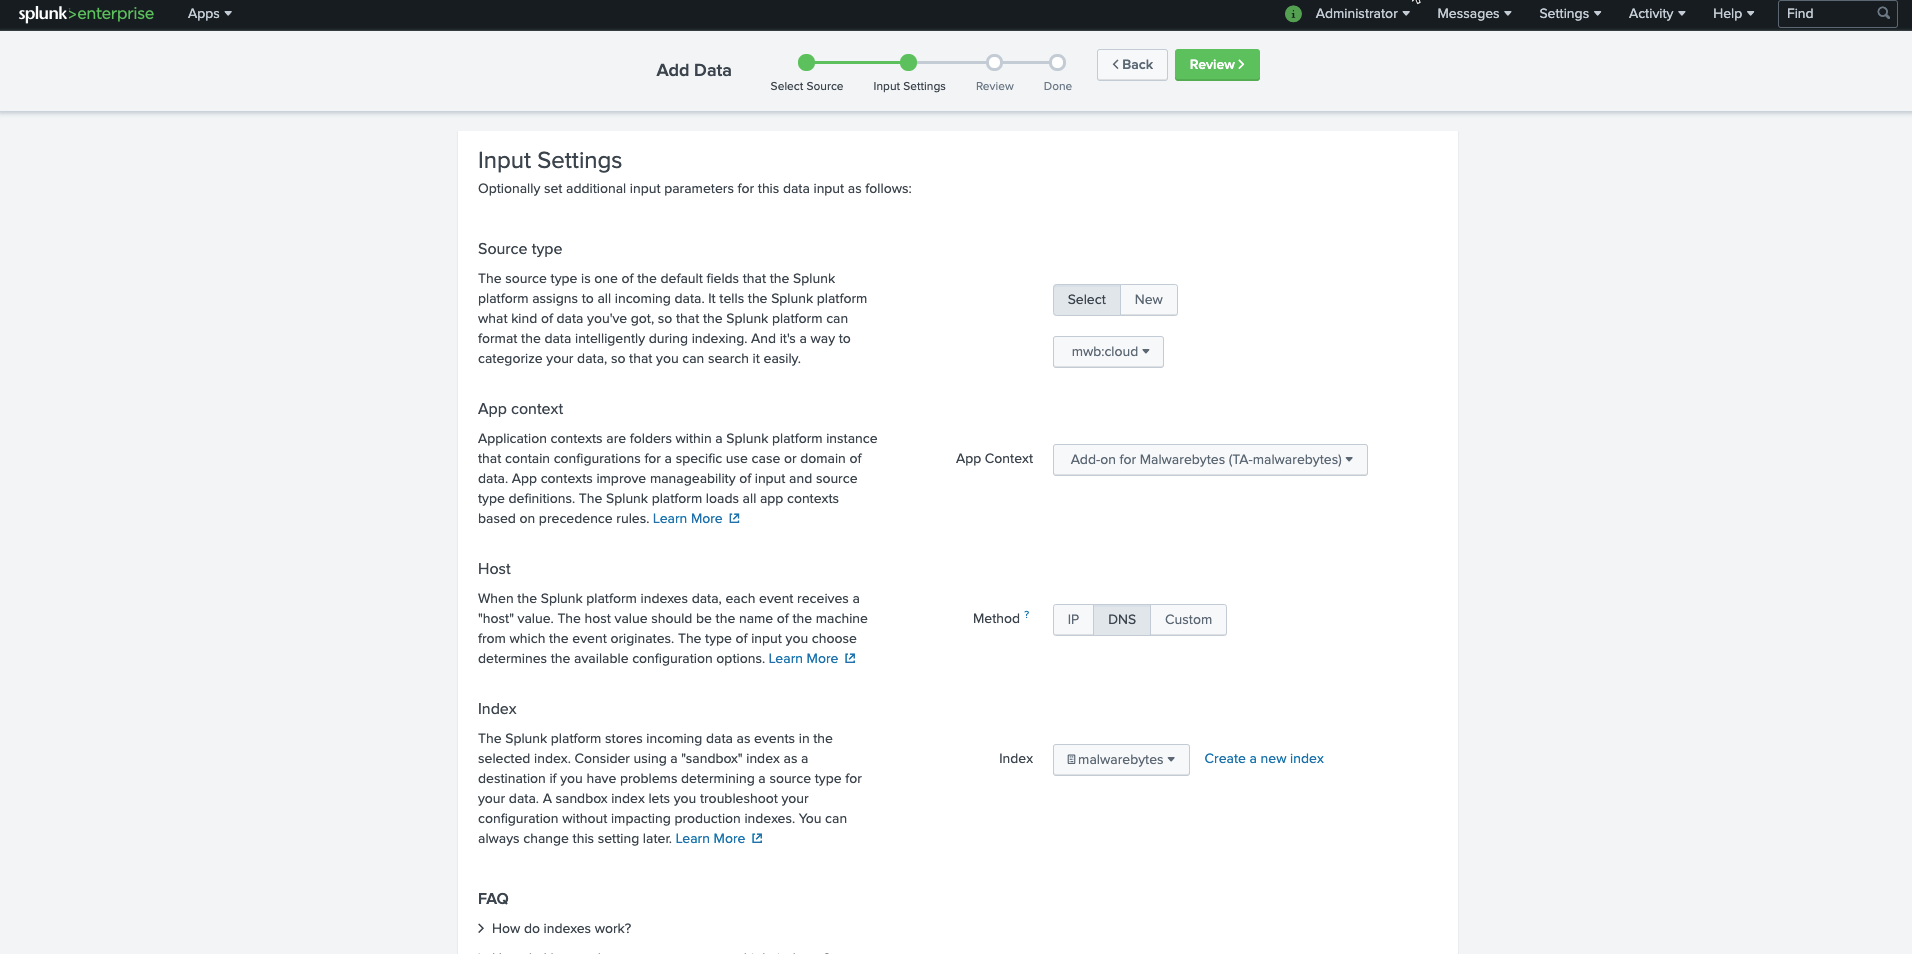
- In the Input Settings screen:
- For Source type, click Select and choose Malware > choose mwb:mbmc from the dropdown menu.
- For App context, select Add-on for Malwarebytes (TA-malwarebytes) from the dropdown menu.
- For Host > Method, select either IP or DNS.
- For Index, select malwarebytes from the dropdown menu. Click Review.
- In Review, make sure all of your configurations are correct, then select Submit to complete the data input configuration on the Splunk instance.
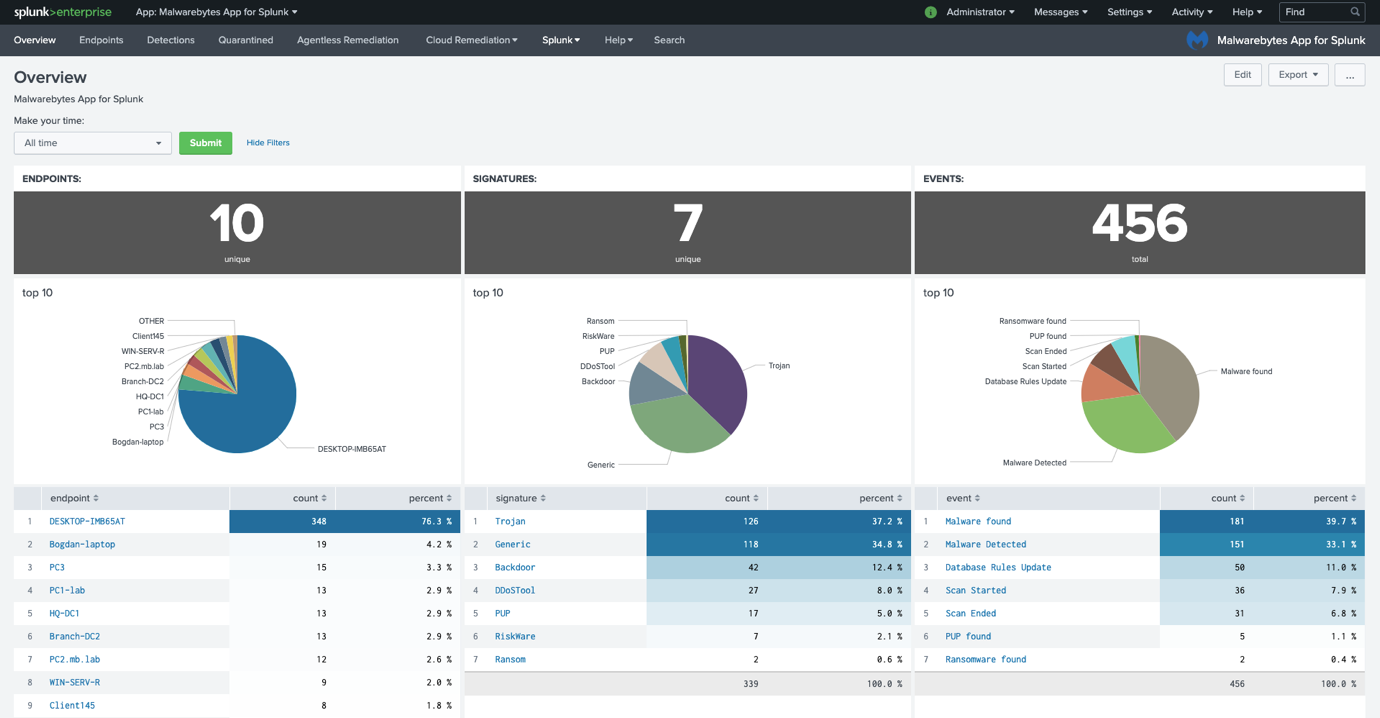
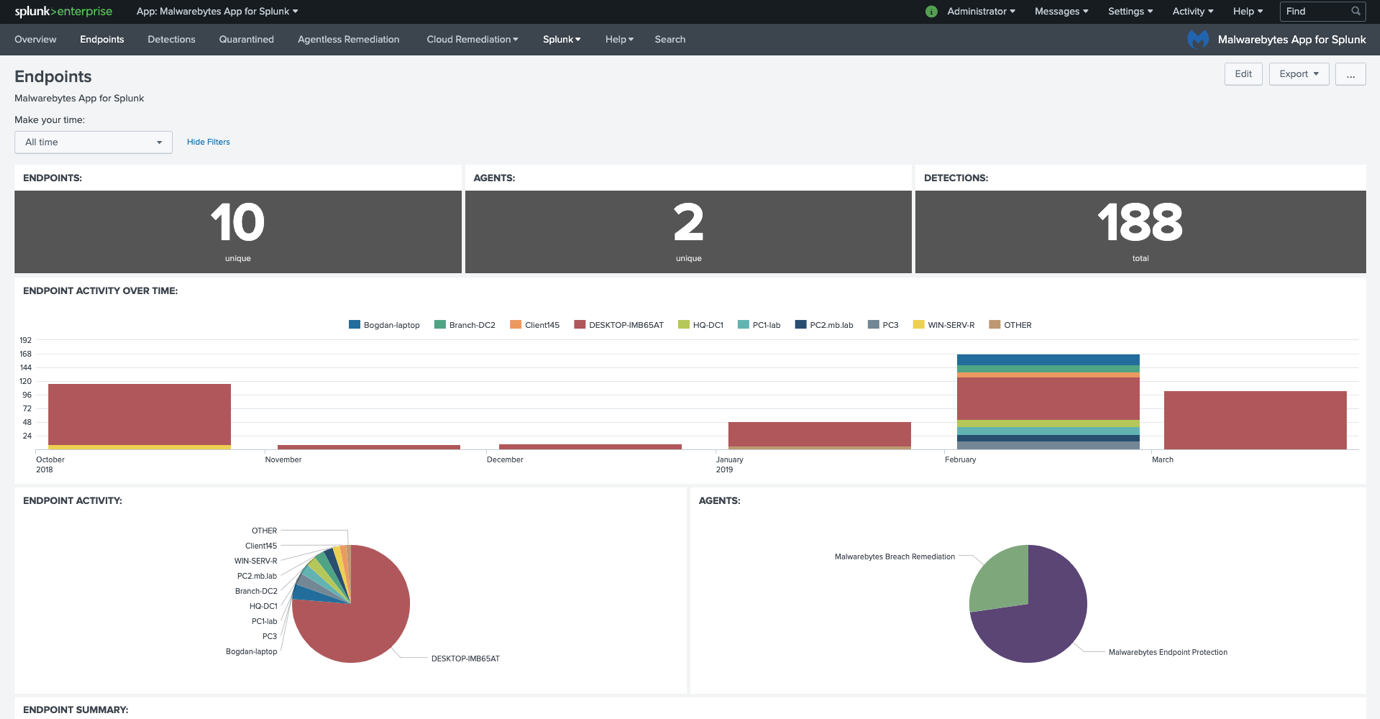
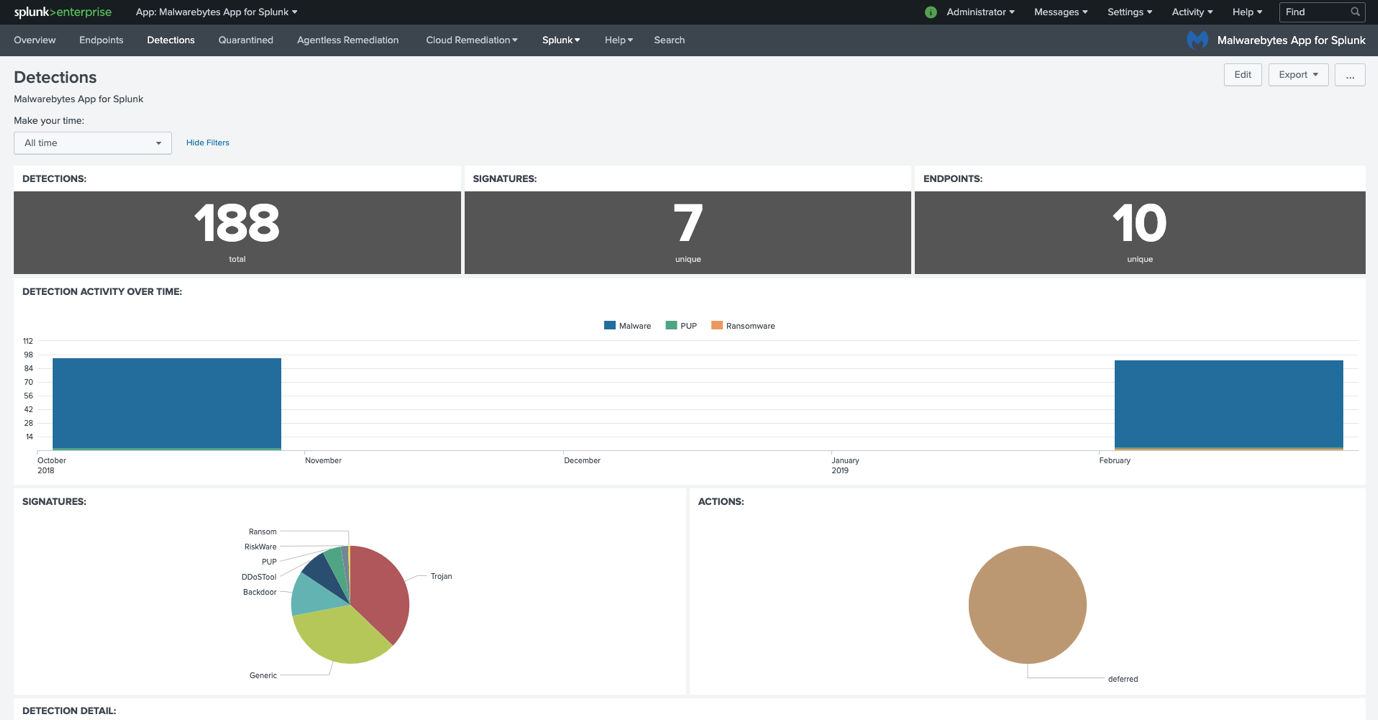
Splunk Enterprise dashboard examples
Overview dashboard
Endpoints dashboard
Detections dashboard
Configure Splunk Cloud
You must have Universal Forwarder installed to configure Splunk Cloud. Refer to the Splunk support document, Configure forwarding and receiving for Splunk Cloud for instructions.
To get Malwarebytes data into Splunk Cloud, configure your forwarder to send syslog data to your Splunk Cloud instance.
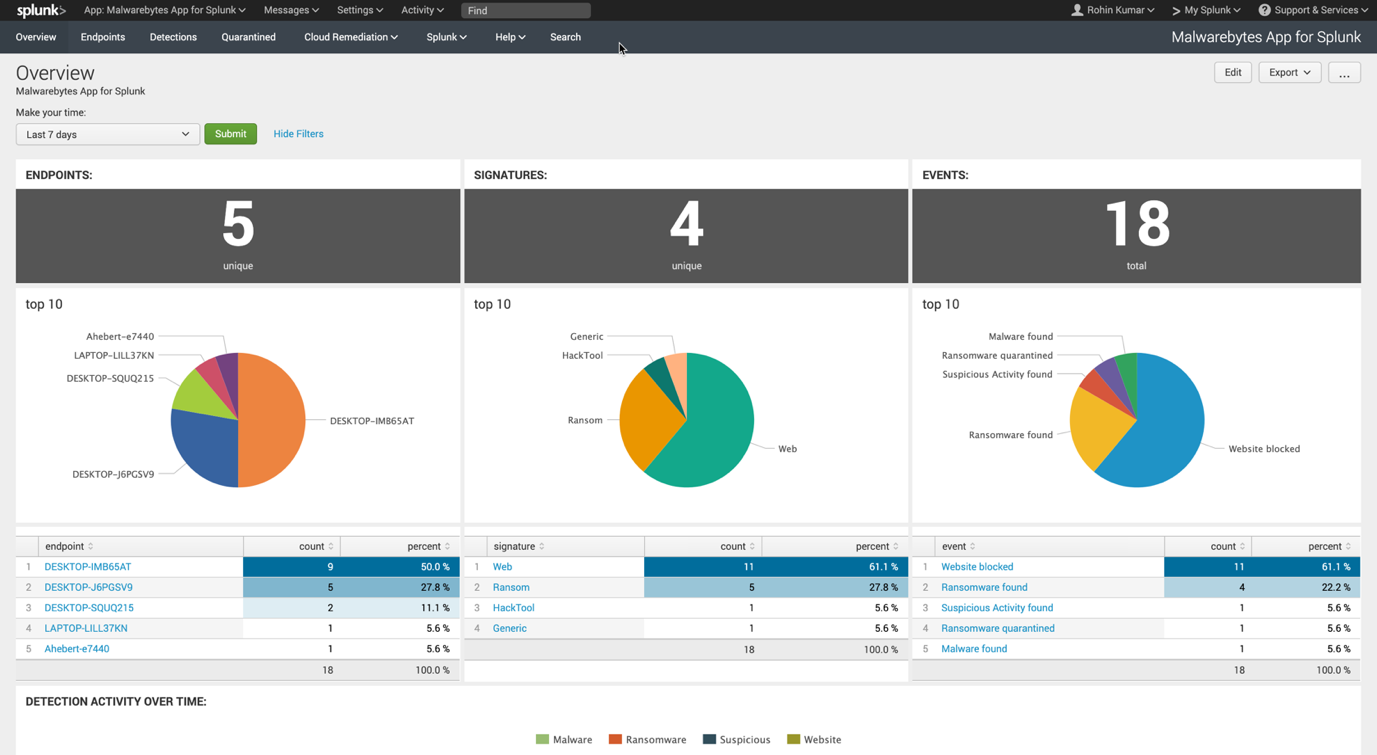
Splunk Cloud dashboard examples
Overview dashboard
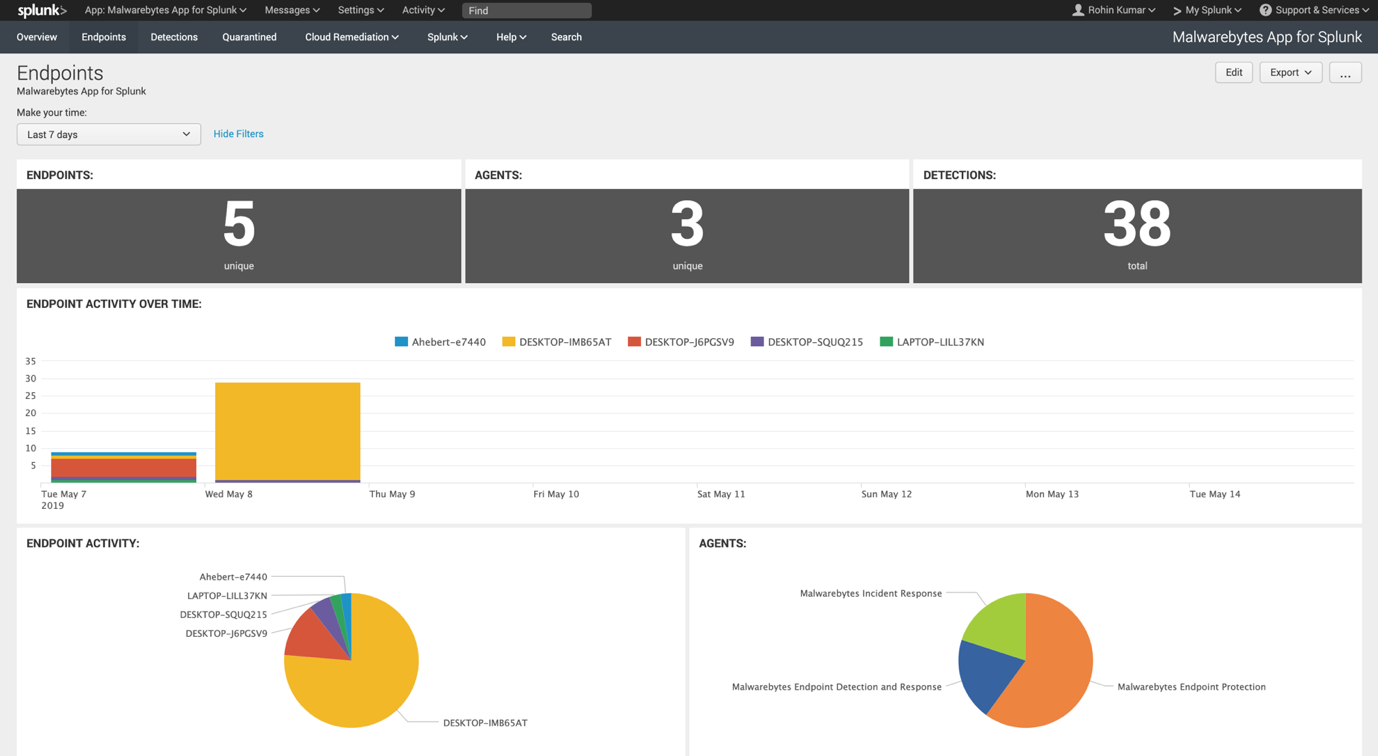
Endpoints dashboard
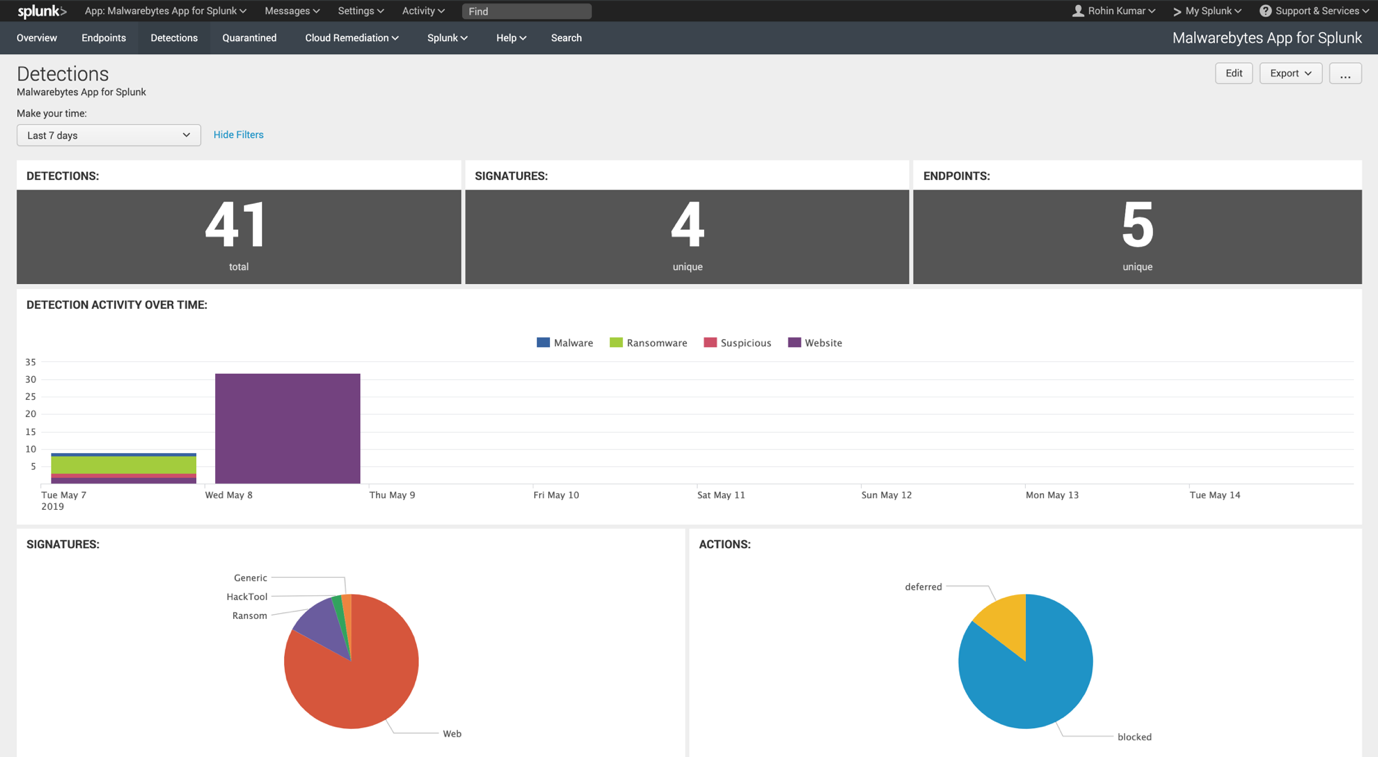
Detections dashboard
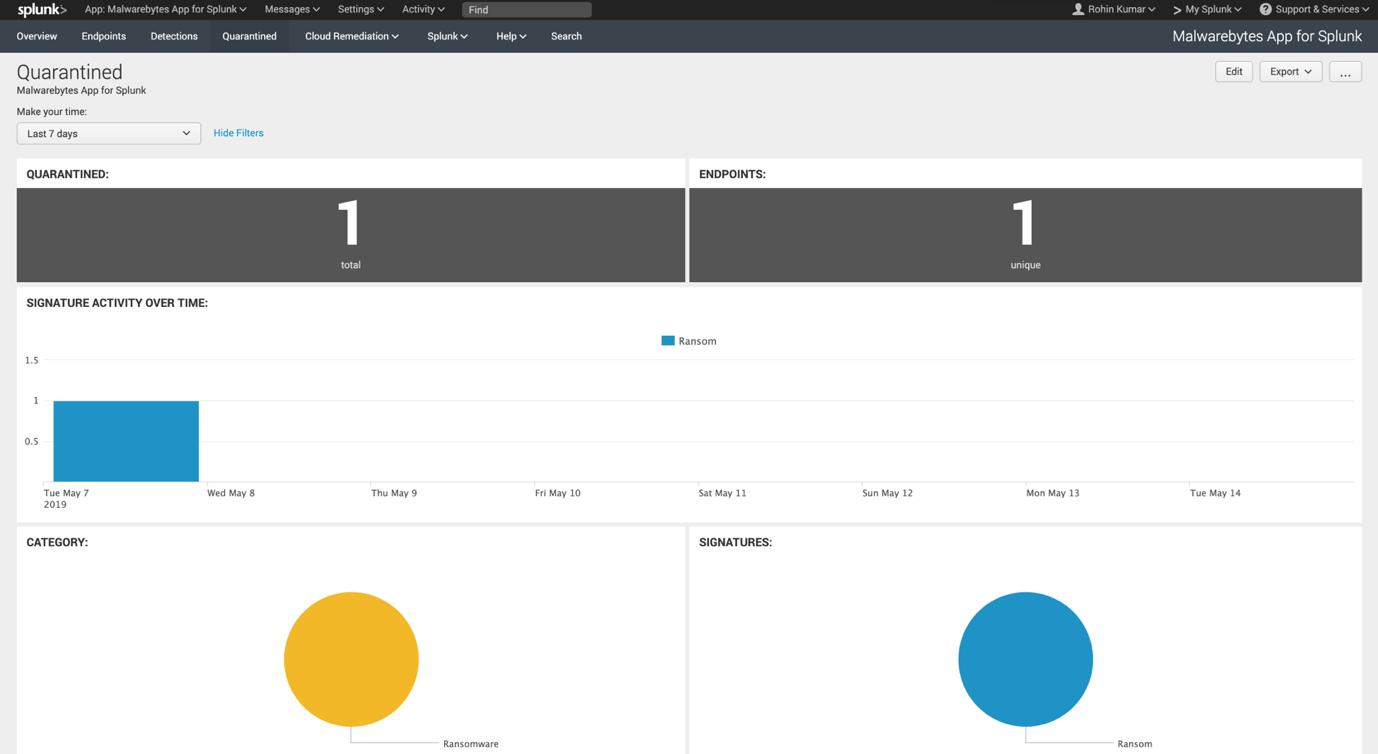
Quarantined dashboard
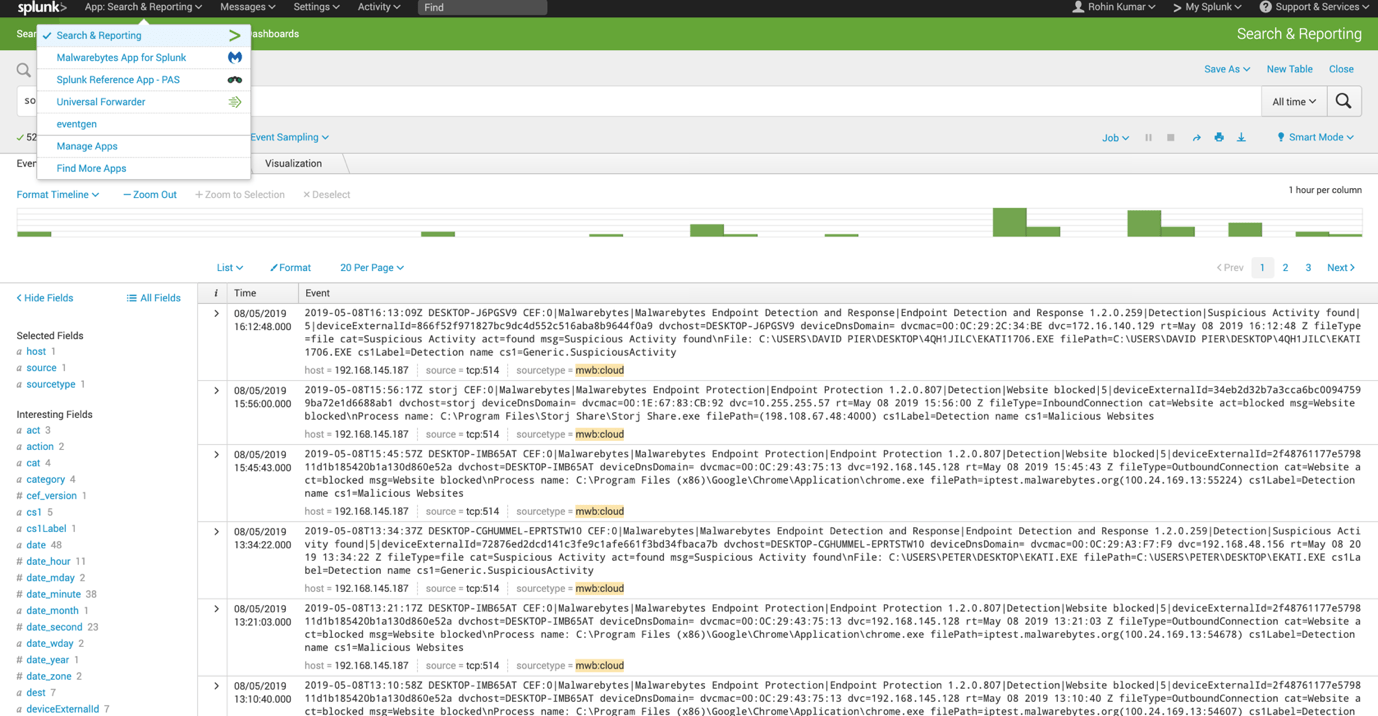
The events received into Splunk Cloud from Malwarebytes products display in CEF format. Go to App: Search & Reporting > Search & Reporting to view.
 .
.
Source : Official Malwarebytes Brand
Editor by : BEST Antivirus KBS Team

