You can enable traces in Kaspersky Embedded Systems Security 1.1 the following ways:
Through Kaspersky Security Console
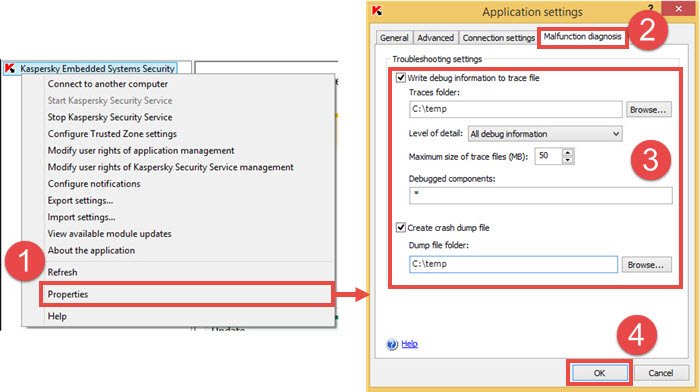
To enable traces through the console of Kaspersky Embedded Systems Security 1.1:
- Expand the properties of the Kaspersky Security node.
- Open the Malfunction diagnosis tab.
- Select the check boxes Write debug information to trace file and Create crash dump file and specify the path to the folder to which trace files will be saved. If necessary, specify the debugged components.
- Click OK.

Debugging information of each subsystem is saved to a separate file in the specified folder (Traces folder). When the maximum size of the trace file is reached, the new file is created and the old one is saved.
- The folder you select as the Traces folder must be an existing one.
- Do not create the Traces folder on network drives of the server or on the drives created using the SUBST command.
- Mind uppercase and lowercase when you specify subsystems for which traces must be enabled (Debugged components), and separate them with commas.
- Make sure there is enough free space on the disk before you enable traces.
Through the registry editor
To enable tracing in the registry, download the archive and run the reg file:
- For 32-bit operating systems: trace_on_x86.reg
The path to the traces folder in the registry:
[HKEY_LOCAL_MACHINE\Software\KasperskyLab\ESS\1.1\Trace] - for 64-bit operating systems: trace_on_x64.reg
The path to the traces folder in the registry:
[HKEY_LOCAL_MACHINE\Software\Wow6432Node\KasperskyLab\ESS\1.1\Trace]
When you enable tracing using reg files, traces will be written to the folder C:\Temp.
To disable traces, run the reg file:
- For 32-bit operating systems: trace_off_x86.reg
- For 64-bit operating systems: trace_off_x64.reg
Subsystem codes in Kaspersky Embedded Systems Security
| Subsystem code | Subsystem name | Tracing start |
|---|---|---|
| * | All subsystems. | |
| gui | ММС console installed on the protected server. | Upon restart of the console. |
| ak_conn | Subsystem for integration with Network Agent. | Upon restart of Network Agent. |
| bl | Controller process responsible for Kaspersky Security administration tasks | Upon saving the tracing settings. |
| wp | Operation process responsible for antivirus protection tasks | |
| blgate | Process of Kaspersky Security remote management | |
| ods | On-Demand Scan subsystem | |
| oas | Real-Time Protection subsystem | |
| qb | Quarantine and backup storage subsystem | |
| scandll | Auxiliary virus scan module | |
| core | Basic antivirus functionality subsystem | |
| avscan | Antivirus processing subsystem | |
| avserv | Antivirus kernel control subsystem | |
| prague | Basic functionality subsystem | |
| updater | Subsystem responsible for database and application module updates | |
| snmp | SNMP protocol support subsystem | Upon restart of the SNMP service |
| perfcount | Performance count subsystem | Upon restart of all processes which use performance counts |
Editor by : BEST Antivirus KBS Team

