You can enable traces in Kaspersky Security 10 for Windows Server in the following ways:
Through the console
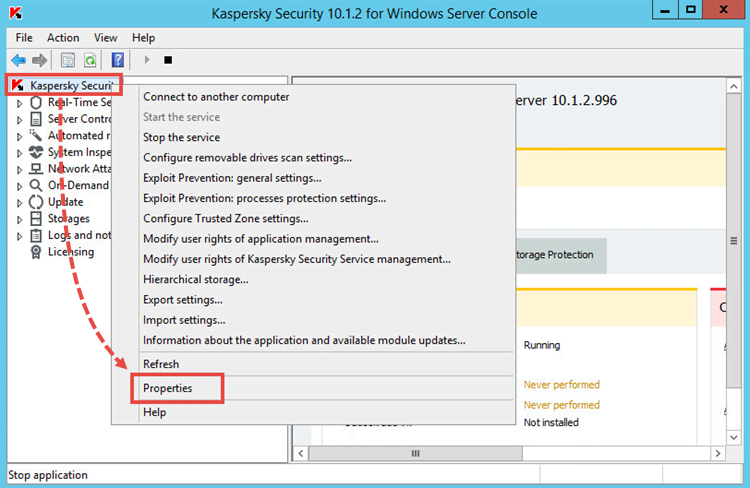
To collect traces for Kaspersky Security 10 for Windows Server through the console:
- Run the console and open the properties of the Kaspersky Security node.

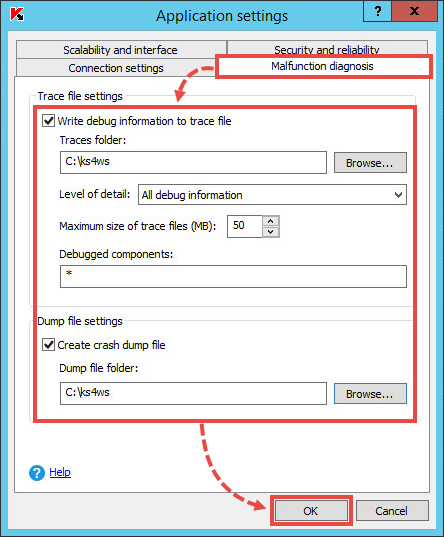
- Open the Malfunction diagnosis tab.
- Select the checkboxes Write debug information to trace file and Create crash dump file and specify the path to the folder to which trace files will be saved. If necessary, specify the debugged components.
-
Always set the level of detail to All debug information unless a technical support engineer requests otherwise.
- Click OK.

Debugging information of each subsystem is saved to a file in the specified folder (Traces folder). When the maximum size of the trace file is reached, the new file is created and the old one is saved.
Do not leave traces enabled for a long time, this may affect the server performance.
- The folder you select as the Traces folder must be an existing one.
- Do not create the Traces folder on network drives of the server or on the drives created using the SUBST command.
- Mind uppercase and lowercase when you specify subsystems for which traces must be enabled (Debugged components), and separate them with commas.
- Make sure there is enough free space on the disk before you enable traces.
Using Compact diagnostic interface
To collect traces for Kaspersky Security 10 for Windows Server:
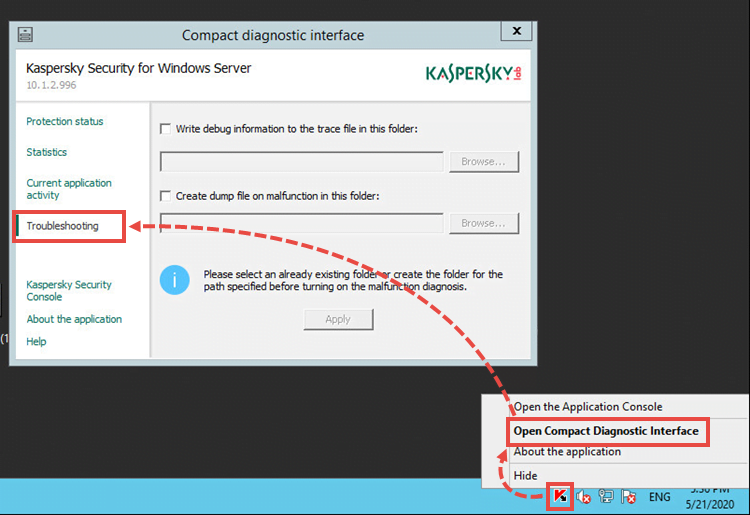
- Right-click the application icon in the notification area and select Open Compact Diagnostic Interface.
- Go to Troubleshooting.

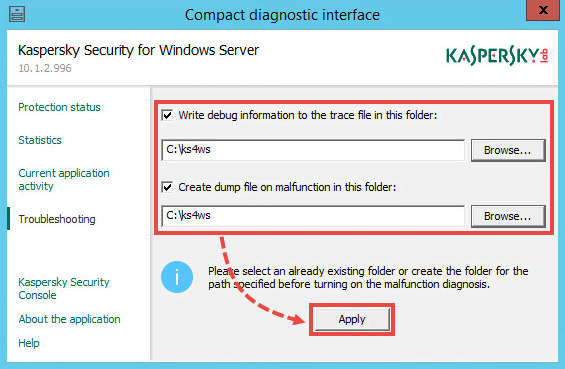
- Select the checkboxes Write debug information to trace file and Create dump file on malfunction in this folder and specify the path to the folder to which trace files will be saved.
- Click Apply.

If you also need a Kaspersky Security 10 for Windows Server connector trace file, restart the Kaspersky Security 10 Network Agent after adding key values to the registry. Open the command line and run the following command:
Then run the command:
Using the KAVSHELL TRACE command
Using the KAVSHELL TRACE command, you can enable or disable tracing of all subsystems of Kaspersky Security 10 for Windows Serveras well as set the level of detail for the log.
To start tracing, open the command line and run the command
If tracing is already enabled and you want to change the parameters, run the KAVSHELL TRACE command with the /ON key and set the parameters using the /S and /LVL keys.
| Key | Description |
|---|---|
| /S:<maximum log file size in MB> | The key sets the maximum size for a trace file. When the file reaches maximum size, Kaspersky Security for Windows Server will create a new trace file. The previous file will be saved. Without this key, the maximum log file size will be 50 MB. |
| /LVL:debug|info|warning|error|critical | The key sets the level of detail for the log with available values ranging from maximum detail (All debug information), which writes all events, to minimum detail (Critical events), when only critical events are logged. Without this key, the level of detail will be automatically set to All debug information. |
Find full description of keys and return codes in the Administrator’s guide.
To disable tracing, run the command
Through the registry editor
To enable tracing in the registry, run the REG file:
- For 32-bit operating systems: trace_on_x86.reg from ksws10_traces_x86.zip.
The path to the section in the registry: HKEY_LOCAL_MACHINE\SOFTWARE\KasperskyLab\WSEE\10.1\Trace\
- For 64-bit operating systems: trace_on_x64.reg from ksws10_traces_x64.zip.
The path to the section in the registry: HKEY_LOCAL_MACHINE\SOFTWARE\Wow6432Node\KasperskyLab\WSEE\10.1\Trace\
When you enable tracing using REG files, traces will be written to the folder C:\Temp. For successful traces collection, make sure the folder exists.
After you add the keys to the registry and restart Kaspersky Security 10 for Windows Server, tracing will start.
To disable tracing, run the REG file:
- For 32-bit operating systems: trace_off_x86.reg from ksws10_traces_x86.zip.
- For 64-bit operating systems: trace_off_x64.reg from ksws10_traces_x64.zip.
After you add the keys to the registry and restart Kaspersky Security 10 for Windows Server, tracing will stop.
If you also need a Kaspersky Security 10 for Windows Server connector trace file, restart the Kaspersky Security 10 Network Agent after adding key values to the registry. Open the command line and run the command
Subsystem codes in Kaspersky Security 10 for Windows Server
| Subsystem code | Subsystem name | Tracing start |
|---|---|---|
| * | All subsystems. | |
| gui | ММС console installed on the protected server. | Upon restart of the console. |
| ak_conn | Subsystem for integration with Network Agent. | Upon restart of Network Agent. |
| bl | Controller process responsible for Kaspersky Security administration tasks | Upon saving the tracing settings. |
| wp | Operation process responsible for antivirus protection tasks | |
| blgate | Process of Kaspersky Security remote management | |
| ods | On-Demand Scan subsystem | |
| oas | Real-Time Protection subsystem | |
| qb | Quarantine and backup storage subsystem | |
| scandll | Auxiliary virus scan module | |
| core | Basic antivirus functionality subsystem | |
| avscan | Antivirus processing subsystem | |
| avserv | Antivirus kernel control subsystem | |
| prague | Basic functionality subsystem | |
| scsrv | Subsystem for dispatching requests from a script interceptor | |
| script | Script interceptor | |
| updater | Subsystem responsible for database and application module updates |
Editor by : BEST Antivirus KBS Team

