The article concerns:
- Kaspersky Security 11.0.1 for Windows Server (version 11.0.1.897)
- Kaspersky Security 11.0.0 for Windows Server (version 11.0.0.480)
You can enable tracing in Kaspersky Security for Windows Server in the following ways:
Through the console
Before you enable traces:
- Note that the folder you select as the Traces folder must be an existing one.
- Do not create the Traces folder on network drives of the server or on the drives created using the SUBST command.
- Mind uppercase and lowercase when you specify subsystems for which traces must be enabled, and separate them with commas.
- Make sure there is enough free space on the disk.
To collect traces for Kaspersky Security for Windows Server through the console:
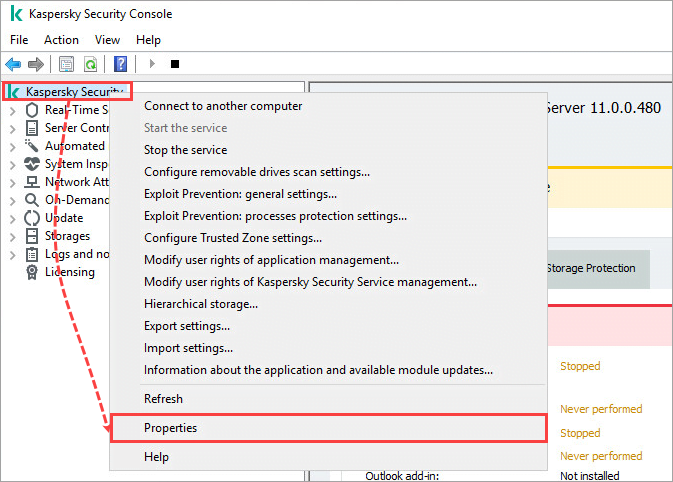
- Run the console and open the properties of the Kaspersky Security node.

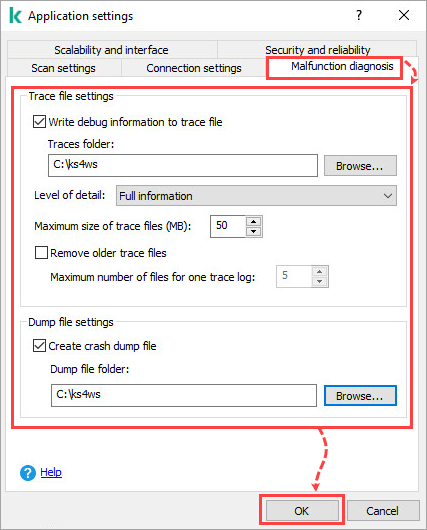
- Open the Malfunction diagnosis tab.
- Select the checkboxes Write debug information to trace file and Create crash dump file and specify the path to the folder to which trace files will be saved.
- Click OK.

Debugging information of each subsystem is saved to a file in the specified folder (Traces folder). When the maximum size of the trace file is reached, the new file is created and the old one is saved.
Do not leave traces enabled for a long time, this may affect the server performance.
Using Compact diagnostic interface
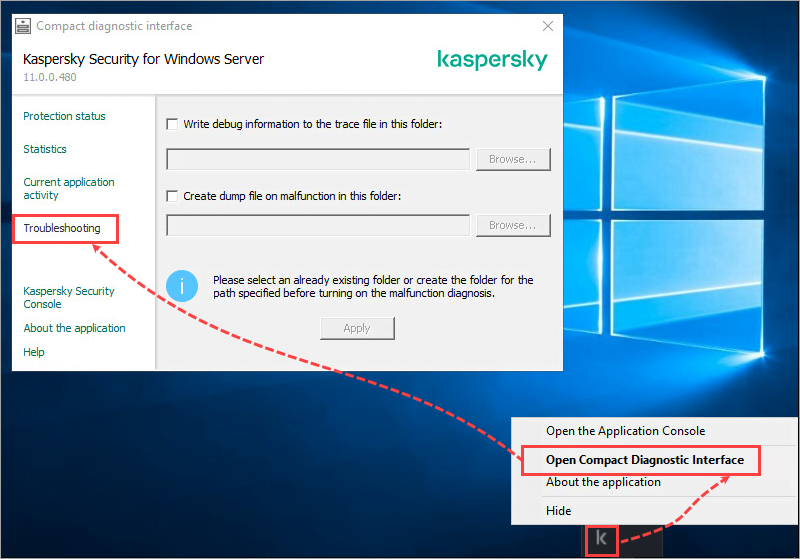
- Right-click the application icon in the notification area and select Open Compact Diagnostic Interface.
- Go to Troubleshooting.

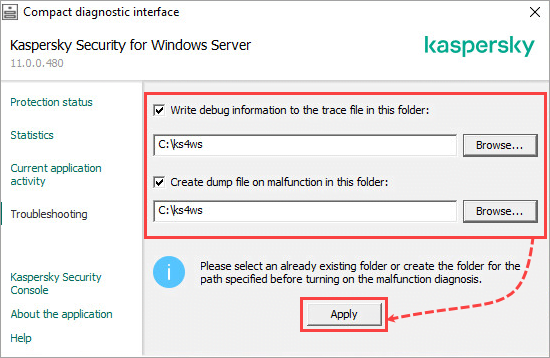
- Select the checkboxes Write debug information to the trace file in this folder and Create dump file on malfunction in this folder and specify the path to the folder to which trace files will be saved.
- Click Apply.

To get a Kaspersky Security for Windows Server connector trace file, see the instructions below.
Using the KAVSHELL TRACE command
Using the KAVSHELL TRACE command, you can enable or disable tracing of all subsystems of Kaspersky Security for Windows Server as well as set the level of detail for the log.
To start tracing, open the command line and run the command:
If tracing is already enabled and you want to change the parameters, run the KAVSHELL TRACE command with the /ON key and set the parameters using the /S and /LVL keys.
| Key | Description |
|---|---|
| /S:<maximum log file size in MB> | The key sets the maximum size for a trace file. When the file reaches maximum size, Kaspersky Security for Windows Server will create a new trace file. The previous file will be saved. Without this key, the maximum log file size will be 50 MB. |
| /LVL:debug|info|warning|error|critical | The key sets the level of detail for the log with available values ranging from maximum detail (All debug information), which writes all events, to minimum detail (Critical events), when only critical events are logged. Without this key, the level of detail will be automatically set to All debug information. |
Find full description of keys and return codes in the Online Help.
To disable tracing, run the command:
Through the registry editor
Run the REG file:
- For 32-bit operating systems: trace_on_x86.reg from ksws11_traces_x86.zip.
Path to the section in the registry: HKEY_LOCAL_MACHINE\SOFTWARE\KasperskyLab\WSEE\11.0\Trace\
- For 64-bit operating systems: trace_on_x64.reg from ksws11_traces_x64.zip.
Path to the section in the registry: HKEY_LOCAL_MACHINE\SOFTWARE\Wow6432Node\KasperskyLab\WSEE\11.0\Trace\
When you enable tracing using REG files, traces will be written to the C:\Temp folder. For successful traces collection, make sure the folder exists.
After you add the keys to the registry, restart Kaspersky Security for Windows Server. Tracing will start.
To disable traces, run the REG file:
- For 32-bit operating systems: trace_off_x86.reg from ksws11_traces_x86.zip.
- For 64-bit operating systems: trace_off_x64.reg from ksws11_traces_x64.zip.
After you add the keys to the registry, restart Kaspersky Security for Windows Server. Tracing will stop. To get a Kaspersky Security for Windows Server connector trace file, see the instructions below.
Editor by : BEST Antivirus KBS Team

