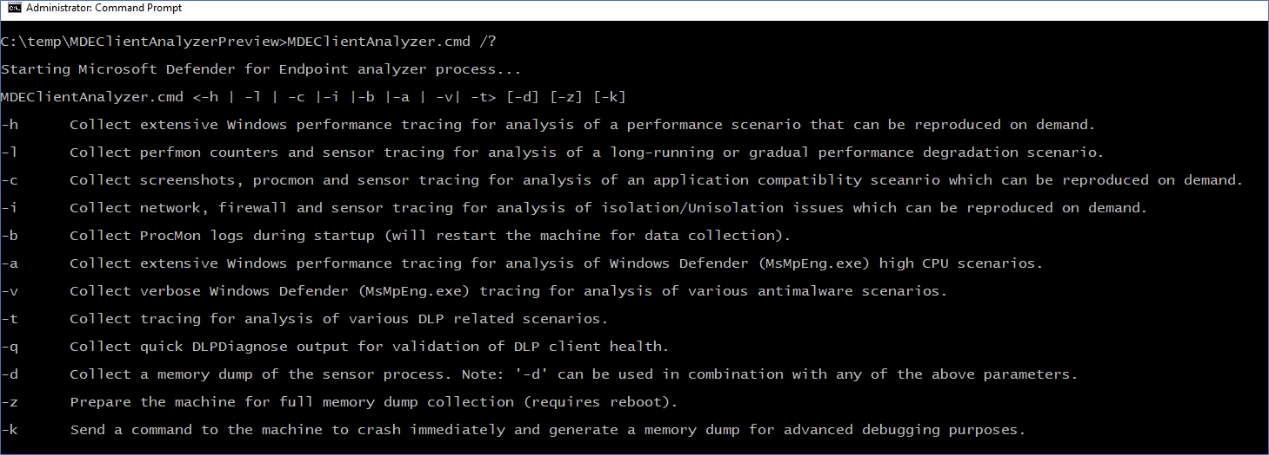
Run ‘MDEClientAnalyzer.cmd /?‘ to see the list of available parameters and their description:

Note
When any advanced troubleshooting parameter is used, the analyzer also calls into MpCmdRun.exe to collect Microsoft Defender Antivirus related support logs.
-h – Calls into Windows Performance Recorder to collect a verbose general performance trace in addition to the standard log set.
-l – Calls into built-in Windows Performance Monitor to collect a lightweight perfmon trace. This may be useful when diagnosing slow performance degradation issues that occur over time but hard to reproduce on demand.
-c – Calls into process monitor for advanced monitoring of real-time file system, registry, and process/thread activity. This is especially useful when troubleshooting various application compatibility scenarios.
-i – Calls into built-in netsh.exe command to start a network and windows firewall trace that is useful when troubleshooting various network-related issues.
-b – Same as ‘-c’ but the process monitor trace will be initiated during next boot and stopped only when the -b is used again.
-a – Calls into Windows Performance Recorder to collect a verbose performance trace specific to analysis of high CPU issues related to the antivirus process (MsMpEng.exe).
-v – Uses antivirus MpCmdRun.exe command line argument with most verbose -trace flags.
-t – Starts verbose trace of all client-side components relevant to Endpoint DLP. This is useful for scenarios where DLP actions are not happening as expected for files.
-q – Calls into DLPDiagnose.ps1 script from the analyzer ‘Tools’ directory that validates the basic configuration and requirements for Endpoint DLP.
-d – Collects a memory dump of MsSenseS.exe (the sensor process on Windows Server 2016 or older OS) and related processes.
- * This flag can be used in conjunction with above mentioned flags.
- ** Capturing a memory dump of PPL protected processes such as MsSense.exe or MsMpEng.exe is not supported by the analyzer at this time.
-z – Configures registry keys on the machine to prepare it for full machine memory dump collection via CrashOnCtrlScroll. This would be useful for analysis of computer freeze issues.
* Hold down the rightmost CTRL key, then press the SCROLL LOCK key twice.
-k – Uses NotMyFault tool to force the system to crash and generate a machine memory dump. This would be useful for analysis of various OS stability issues.
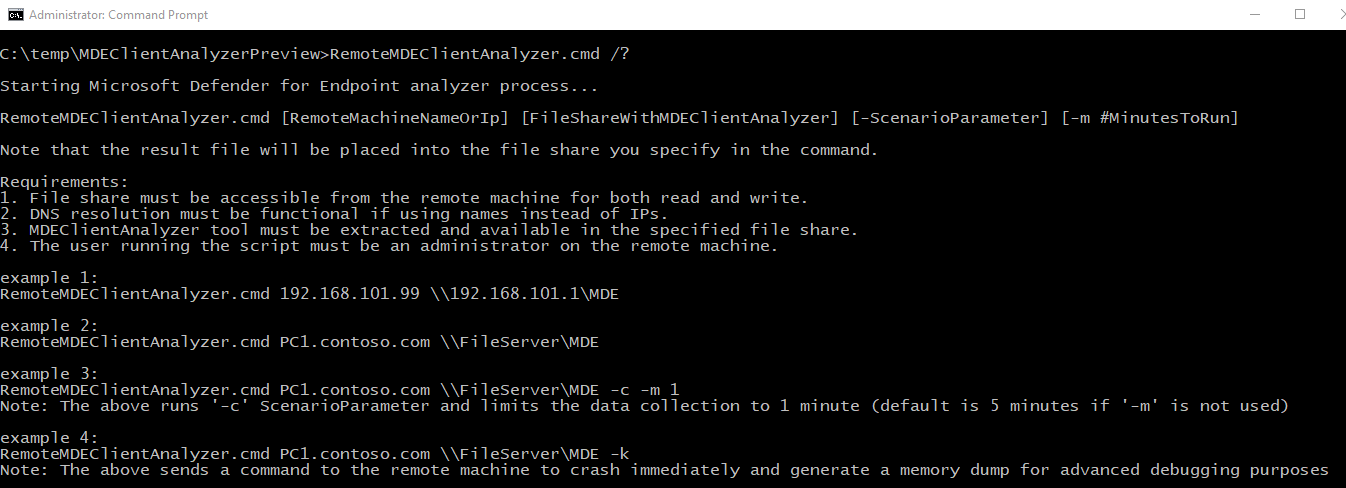
The analyzer and all the above scenario flags can be initiated remotely by running ‘RemoteMDEClientAnalyzer.cmd’, which is also bundled into the analyzer toolset:

Note
- When using RemoteMDEClientAnalyzer.cmd it calls into psexec to download the tool from the configured file share and then run it locally via PsExec.exe. The CMD script uses ‘-r’ flag to specify that it is running remotely within SYSTEM context and so no prompt to the user will be presented.
- That same flag can be used with MDEClientAnalyzer.cmd to avoid a prompt to user that requests to specify the number of minutes for data collection. For example:
MDEClientAnalyzer.cmd -r -i -m 5
- -r – Indicates that tool is being run from remote (or non-interactive context)
- -i – Scenario flag for collection of network trace along with other related logs
- -m # – The number of minutes to run (5 minutes in the above example)

