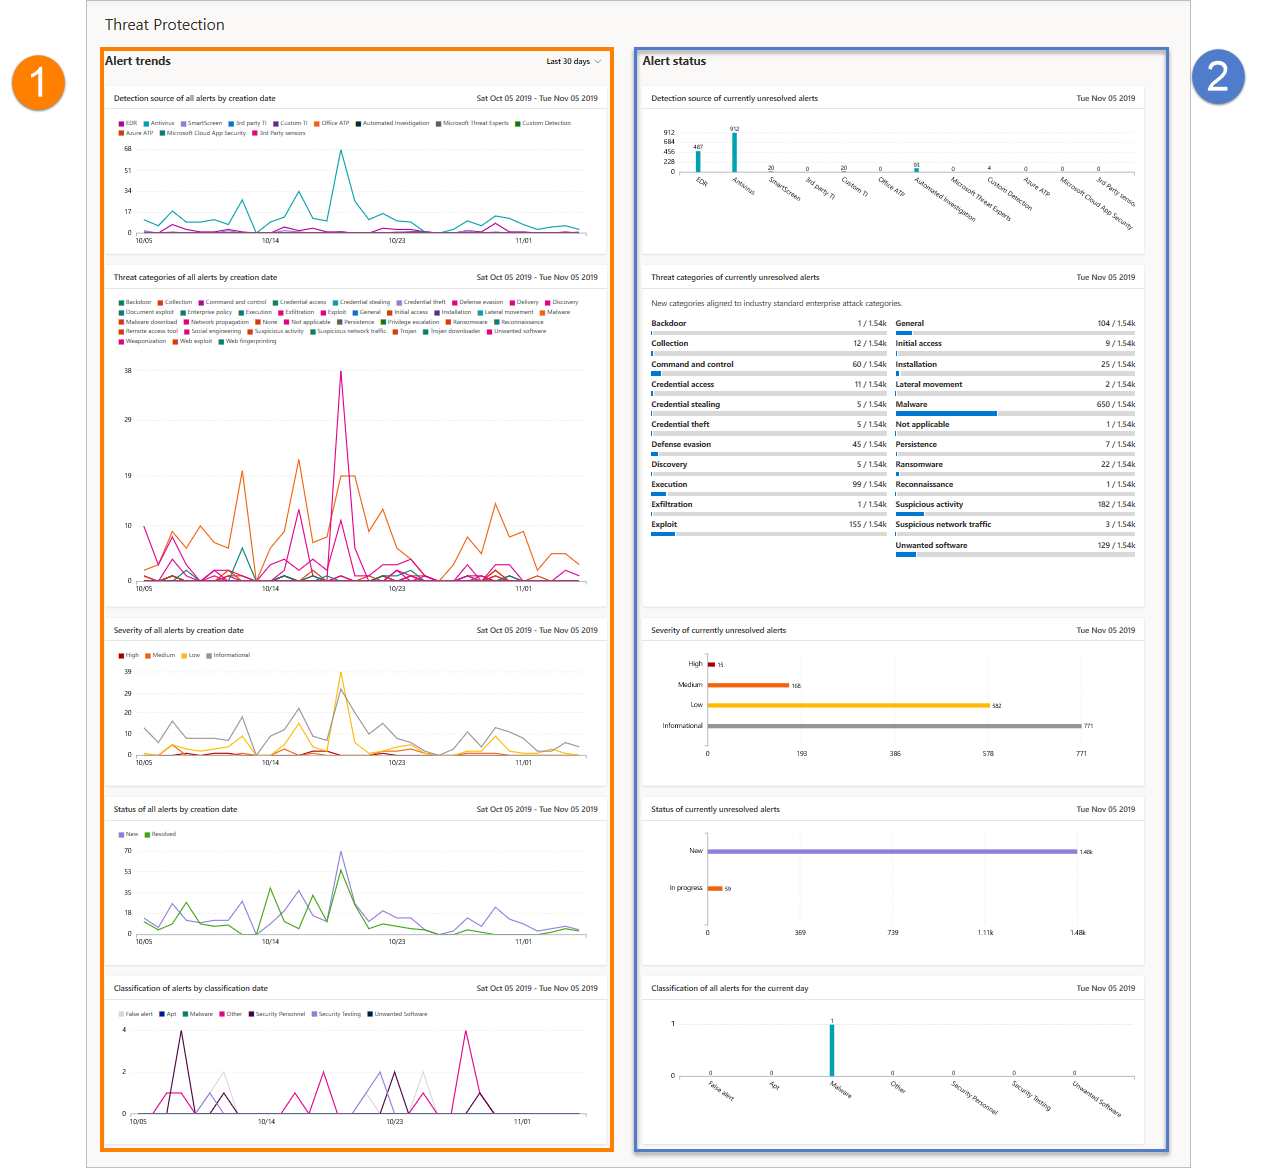
The threat protection report provides high-level information about alerts generated in your organization. The report includes trending information showing the detection sources, categories, severities, statuses, classifications, and determinations of alerts across time.
The dashboard is structured into two sections:

| Section | Description |
|---|---|
| 1 | Alerts trends |
| 2 | Alert summary |
Alert trends
By default, the alert trends display alert information from the 30-day period ending in the latest full day. To gain better perspective on trends occurring in your organization, you can fine-tune the reporting period by adjusting the time period shown. To adjust the time period, select a time range from the drop-down options:
- 30 days
- 3 months
- 6 months
- Custom
Note
These filters are only applied on the alert trends section. It doesn’t affect the alert summary section.
Alert summary
While the alert trends shows trending alert information, the alert summary shows alert information scoped to the current day.
The alert summary allows you to drill down to a particular alert queue with the corresponding filter applied to it. For example, clicking on the EDR bar in the Detection sources card will bring you the alerts queue with results showing only alerts generated from EDR detections.
Note
The data reflected in the summary section is scoped to 180 days prior to the current date. For example if today’s date is November 5, 2019, the data on the summary section will reflect numbers starting from May 5, 2019 to November 5, 2019.
The filter applied on the trends section is not applied on the summary section.
Alert attributes
The report is made up of cards that display the following alert attributes:
- Detection sources: shows information about the sensors and detection technologies that provide the data used by Microsoft Defender for Endpoint to trigger alerts.
- Threat categories: shows the types of threat or attack activity that triggered alerts, indicating possible focus areas for your security operations.
- Severity: shows the severity level of alerts, indicating the collective potential impact of threats to your organization and the level of response needed to address them.
- Status: shows the resolution status of alerts, indicating the efficiency of your manual alert responses and of automated remediation (if enabled).
- Classification & determination: shows how you have classified alerts upon resolution, whether you have classified them as actual threats (true alerts) or as incorrect detections (false alerts). These cards also show the determination of resolved alerts, providing additional insight like the types of actual threats found or the legitimate activities that were incorrectly detected.
Filter data
Use the provided filters to include or exclude alerts with certain attributes.
Note
These filters apply to all the cards in the report.
For example, to show data about high-severity alerts only:
- Under Incidents & alerts > Alerts > Filters > Severity, select High.
- Ensure that all other options under Severity are deselected.
- Select Apply.

