
Important
The improved Microsoft 365 Defender portal is now available. This new experience brings Defender for Endpoint, Defender for Office 365, Microsoft 365 Defender, and more into the Microsoft 365 Defender portal. Learn what’s new.
Applies to:
- Microsoft 365 Defender
As you spend some time establishing, implementing, and maintaining security measures according to the organization’s standards, you can set up security solutions to help you quickly identify security risks and threats. Microsoft 365 Defender allows you to detect, triage, and investigate incidents through its single-pane-of-glass experience where you can find the information you need to make timely decisions.
Once a security incident is detected, Microsoft 365 Defender presents details you will need to triage or prioritize an incident or incidents over others. After determining prioritization, analysts can then focus their energy on investigating cases assigned to them.
Detection by Microsoft 365 Defender
Microsoft 365 Defender receives alerts and events from multiple Microsoft security platforms as detection sources to create a holistic picture and context of malicious activity. These are the possible detection sources:
- Microsoft Defender for Endpoint is an endpoint detection and response solution (EDR) that uses Microsoft Defender antivirus and cloud-enabled advanced threat protection using Microsoft Security Graph. Defender for Endpoint is a unified platform for preventative protection, post-breach detection, automated investigation, and response. It protects endpoints from cyberthreats, detects advanced attacks and data breaches, automates security incidents, and improves security posture.
- Microsoft Defender for Identity is a cloud-based security solution that uses your on-premises Active Directory Domain Services (AD DS) signals to identify, detect, and investigate advanced threats, compromised identities, and malicious insider actions directed at your organization.
- Microsoft Defender for Cloud Apps acts as a gatekeeper to broker access in real time between your enterprise users and the cloud resources they use, wherever your users are located and regardless of the device they are using.
- Microsoft Defender for Office 365 safeguards your organization against malicious threats in email messages, links (URLs), and collaboration tools.
- Azure Security Center is a unified infrastructure security management system that strengthens the security posture of your data centers and provides advanced threat protection across your hybrid workloads in the cloud and on premises.
In Microsoft 365 Defender, incidents are identified by correlating alerts from these different detection sources. Instead of spending resources stringing together or distinguishing multiple alerts into their respective incidents, you can start with the incident queue in Microsoft 365 Defender right away. This allows you to triage incidents in an efficient manner across endpoints, identities, email, and applications, and reduce the damage from an attack.
Triage your incidents
Incident response in Microsoft 365 Defender starts once you triage the list of incidents using your organization’s recommended method of prioritization. To triage means to assign a level of importance or urgency to incidents, which then determines the order in which they will be investigated.
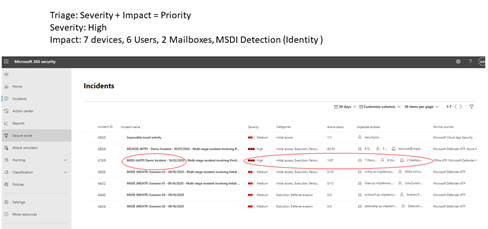
A useful sample guide for determining which incident to prioritize in Microsoft 365 Defender can be summarized by the formula: Severity + Impact = Priority.
- Severity is the level designated by Microsoft 365 Defender and its integrated security components.
- Impact is determined by the organization and generally includes, but not limited to, a threshold number of impacted users, devices, services affected (or a combination thereof), and even alert type.
Analysts then initiate investigations based on the Priority criteria set by the organization.
Incident prioritization might vary depending on the organization. NIST recommends also considering the functional and informational impact of the incident, and recoverability.
The following is just one approach to triage:
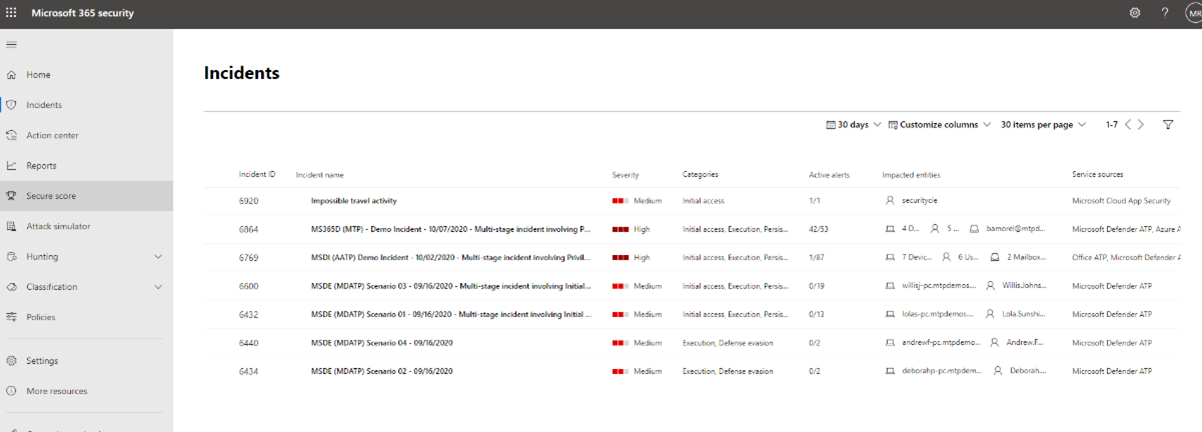
- Go to the incidents page to initiate triage. Here you can see a list of incidents affecting your organization. By default, they are arranged from the most recent to the oldest incident. From here, you can also see different columns for each incident showing their severity, category, number of active alerts, and impacted entities, among others. You can customize the set of columns and sort the incident queue by some of these columns by selecting the column name. You can also filter the incident queue according to your needs. For a full list of available filters, see Prioritize incidents.
One example of how you might perform triage for this set of incidents is to prioritize incidents that affected more users and devices. In this example, you might prioritize incident ID 6769 because it affected the largest number of entities: 7 devices, 6 users, and 2 mailboxes. Furthermore, the incident appears to contain alerts from Microsoft Defender for Identity, which indicate an identity-based alert and possible credential theft.
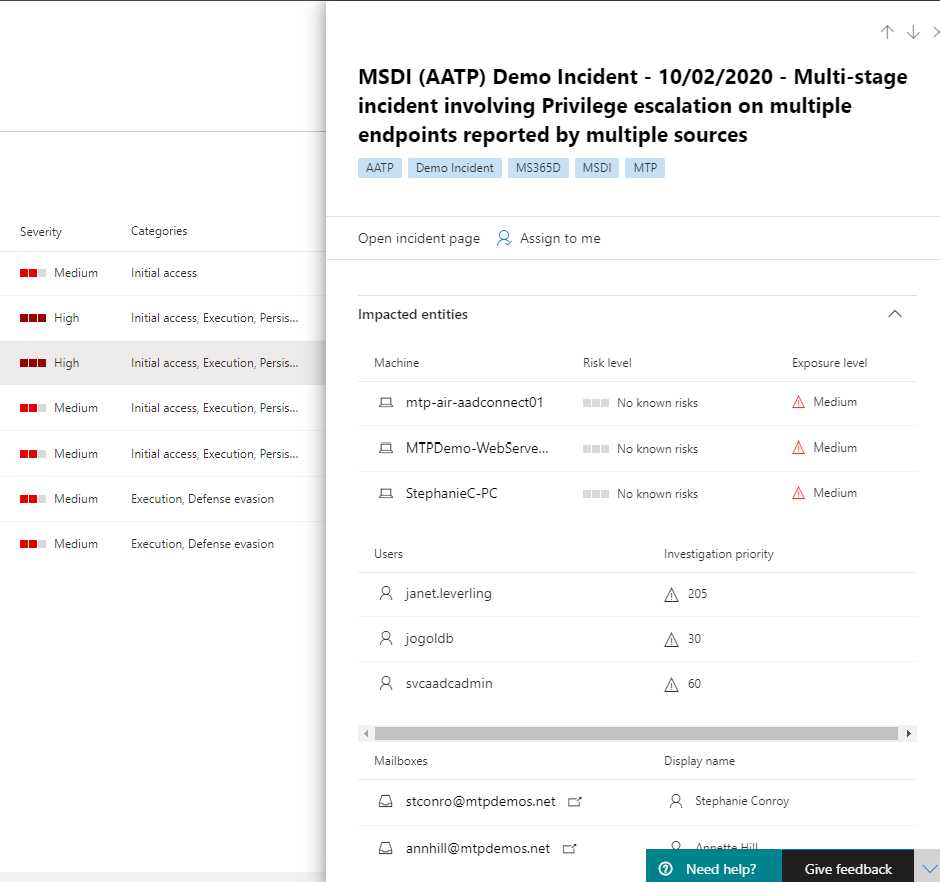
- Select the circle next to the incident name to review the details. A side pane will appear on the right side, which contains additional information that can assist your triage further.
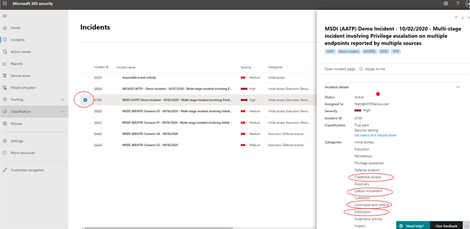
For example, by looking at which MITRE ATT&CK tactics the attacker used based on the incident’s categories, you might prioritize this incident because the attacker used stolen credentials, established command and control, performed lateral movement, and exfiltrated some data. This suggests the attacker has already gone deep into the network and possibly stolen confidential information.
Additionally, if your organization has implemented the Zero Trust framework, you would consider credential access as an important security violation worth prioritizing.
Scrolling down the side pane, you will see the specific impacted entities such as users, devices, and mailboxes. You can check the exposure level of each device and the owners of affected mailboxes.
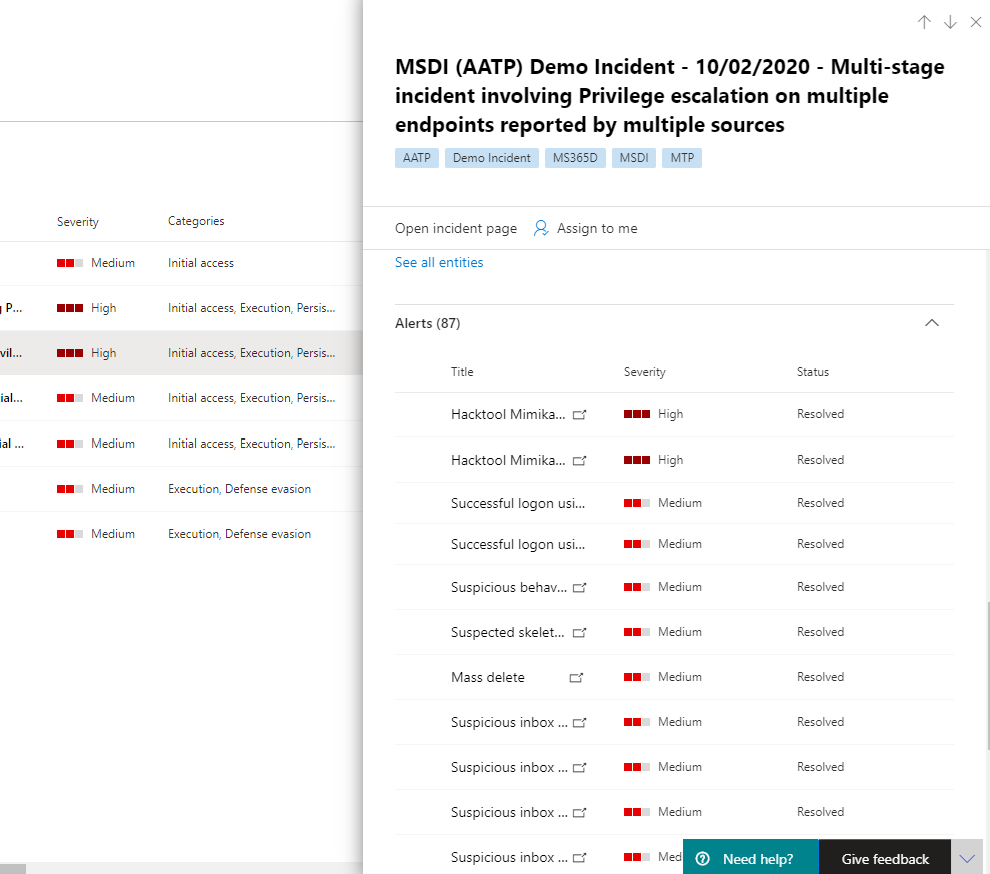
- Further down the side pane, you can find the associated alerts. Microsoft 365 Defender has already performed the correlation of said alerts into a single incident, saving you time and resources better spent remediating the attack. Alerts are suspicious and therefore possibly malicious system events that suggest the presence of an attacker on a network.
In this example, 87 individual alerts were determined to be part of one security incident. You can view all the alerts to get a quick view of how the attack played out.
Analyze your first incident
Understanding the context surrounding alerts is equally important. Often an alert is not a single independent event. There is a chain of processes created, commands, and actions that might not have occurred at the same time. Therefore, an analyst must look for the first and last activities of the suspicious entity in device timelines to understand the context of the alerts.
There are multiple ways to read and analyze data using Microsoft 365 Defender but the end goal for analysts is to respond to incidents as quickly as possible. While Microsoft 365 Defender can significantly reduce Mean Time to Remediate (MTTR) through the industry-leading automated investigation and response feature, there are always cases that require manual analysis.
Here’s an example:
- Once triage priority has been determined, an analyst begins an in-depth analysis by selecting the incident name. This page brings up the Incident Summary where data is displayed in tabs to assist with the analysis. Under the Alerts tab, the type of alerts are displayed. Analysts can click on each alert to drill down into the respective detection source.
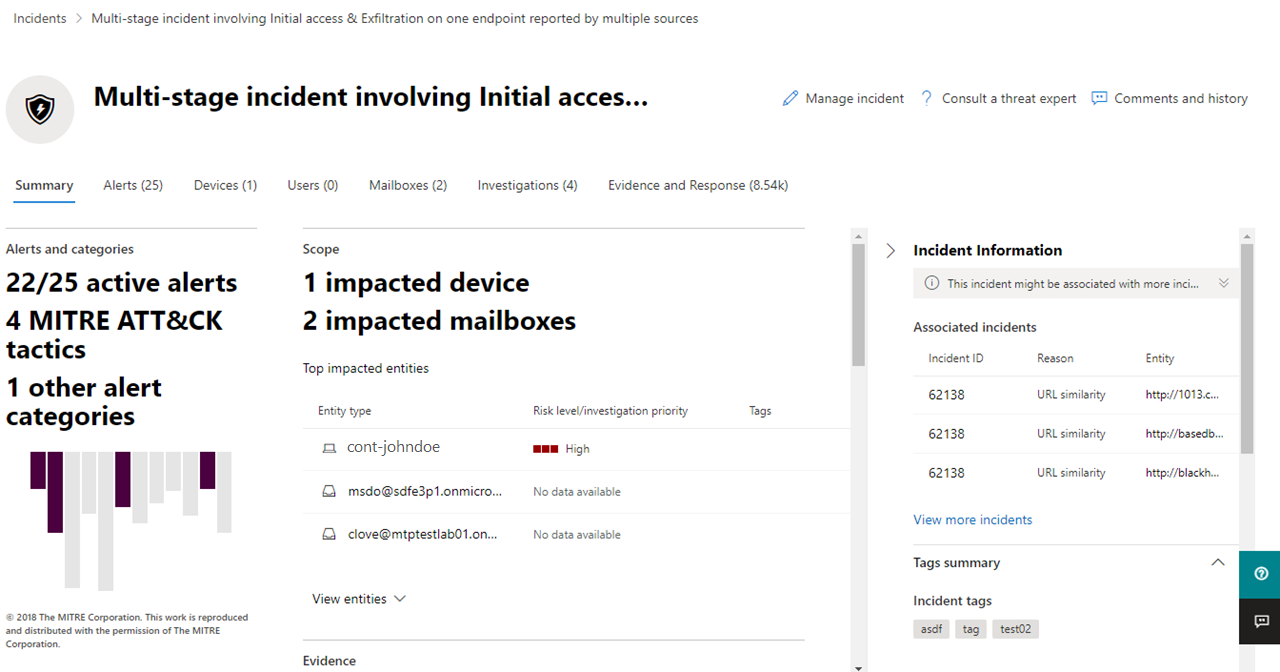
For a quick guide about which domain each detection source covers, review the Detect section of this article.
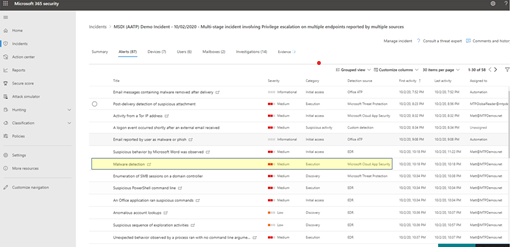
- From the Alerts tab, an analyst can pivot to the detection source to conduct a more in-depth investigation and analysis. For example, selecting Malware Detection with Microsoft Defender for Cloud Apps as the detection source takes the analyst to its corresponding alert page.
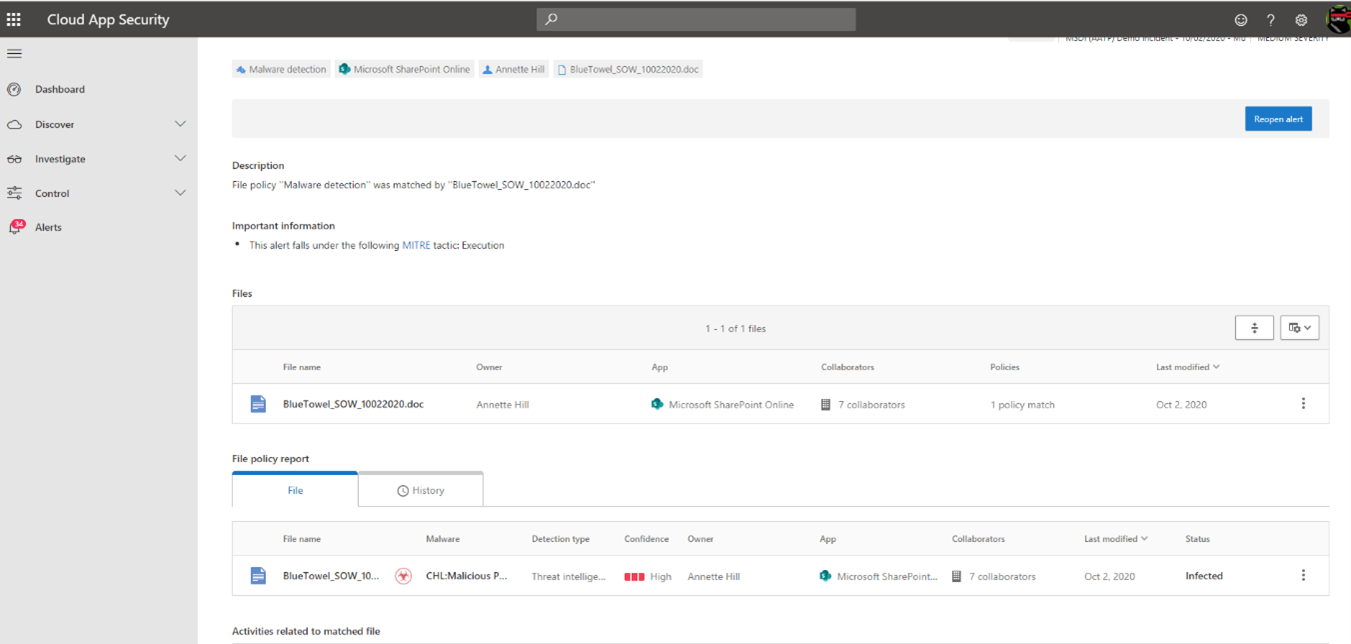
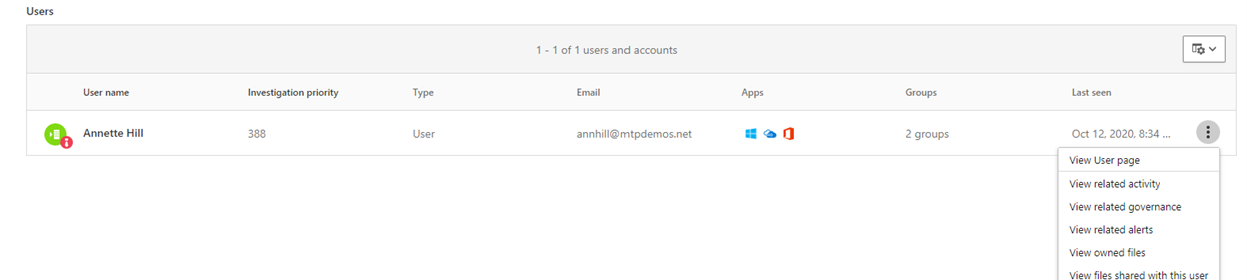
- To investigate our example further, scrolling to the bottom of the page to view the Users affected. To see the activity and context surrounding the malware detection, select Annette Hill’s user page .
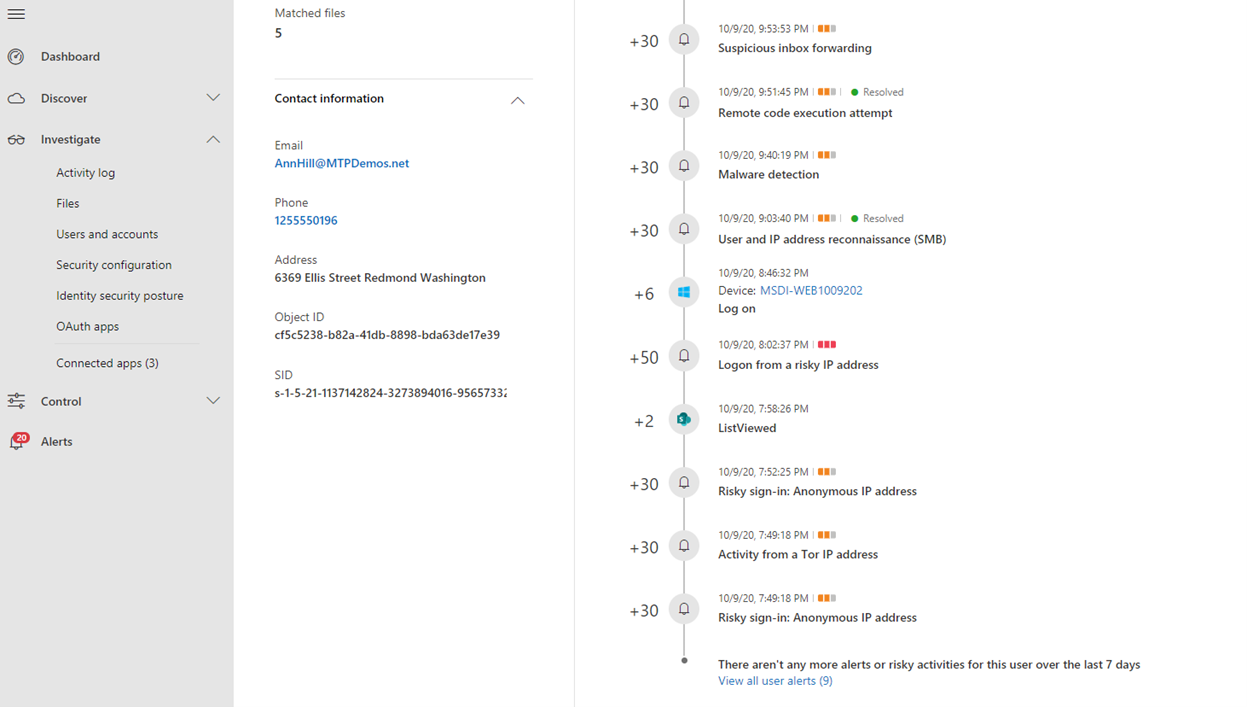
- On the user page is a chronological list of events starting with a Risky Sign-in from a TOR network IP Address alert. While the suspiciousness of an activity depends on the nature of how an organization conducts its business, in most cases the use of The Onion Router (TOR), a network that allows users to browse the web anonymously, in an enterprise environment might be considered highly unlikely and unnecessary for regular online operations.
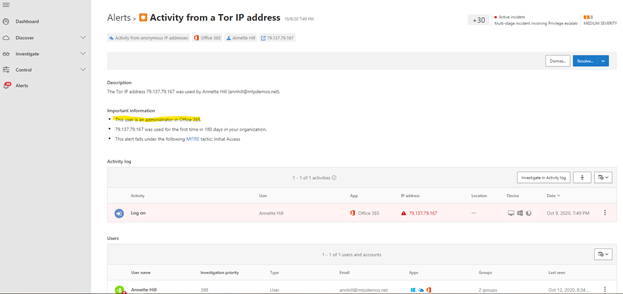
- Each alert can be selected to obtain more information on the activity. For example, selecting Activity from a Tor IP Address alert leads you to that alert’s own page. Annette is an Administrator of Office 365, which means she has elevated privileges and the source incident might have led to access to confidential information.
- By selecting other alerts, an analyst can get a complete picture of the attack.