Note
We’ve renamed Microsoft Cloud App Security. It’s now called Microsoft Defender for Cloud Apps. In the coming weeks, we’ll update the screenshots and instructions here and in related pages. For more information about the change, see this announcement. To learn more about the recent renaming of Microsoft security services, see the Microsoft Ignite Security blog.
The Microsoft Defender for Cloud Apps integration with Microsoft Defender for Endpoint provides a seamless Shadow IT visibility and control solution. Our integration enables Defender for Cloud Apps administrators to investigate discovered devices, network events, and app usage.
Investigate discovered devices in Defender for Cloud Apps
After you integrate Defender for Endpoint with Defender for Cloud Apps, you can investigate discovered device data in the Cloud Discovery dashboard.
- In Defender for Cloud Apps, select Cloud Discovery and then Cloud Discovery dashboard.
- In the top navigation bar, under Continuous reports, select Win10 endpoint users.
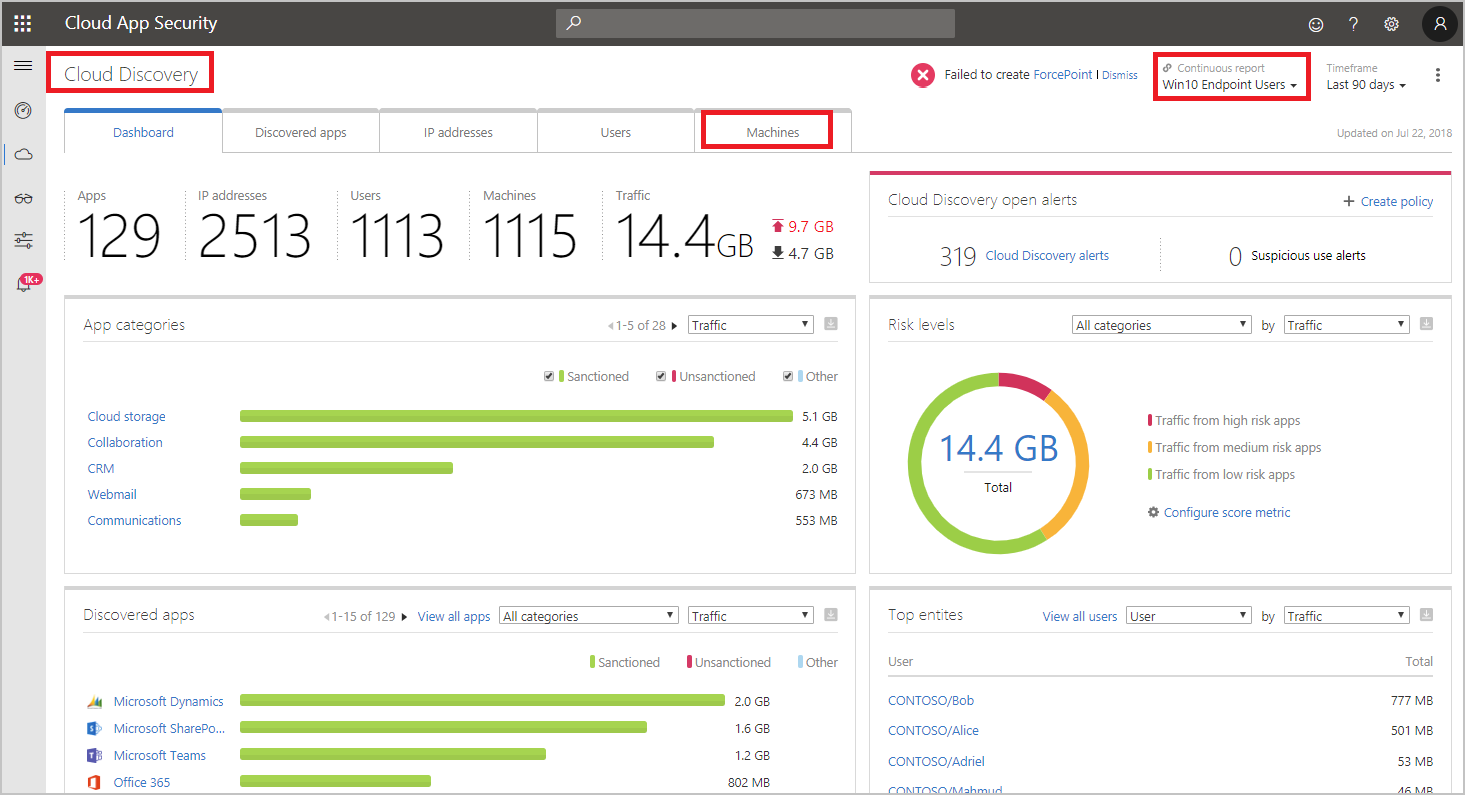
- Across the top, you’ll see the number of discovered devices added after the integration.
- Select the Devices tab.
- You can drill down into each device that’s listed, and use the tabs to view the investigation data. Find correlations between the devices, the users, IP addresses, and apps that were involved in incidents:
- Overview
- Device risk level: Shows how risky the device’s profile is relative to other devices in your organization, as indicated by the severity (high, medium, low, informational). Defender for Cloud Apps uses device profiles from Defender for Endpoint for each device based on advanced analytics. Activity that is anomalous to a device’s baseline is evaluated and determines the device’s risk level. Use the device risk level to determine which devices to investigate first.
- Transactions: Information about the number of transactions that took place on the device over the selected period of time.
- Total traffic: Information about the total amount of traffic (in MB) over the selected period of time.
- Uploads: Information about the total amount of traffic (in MB) uploaded by the device over the selected period of time.
- Downloads: Information about the total amount of traffic (in MB) downloaded by the device over the selected period of time.
- Discovered apps
Lists all the discovered apps that were accessed by the device. - User history
Lists all the users who signed in to the device. - IP address history
Lists all the IP addresses that were assigned to the device.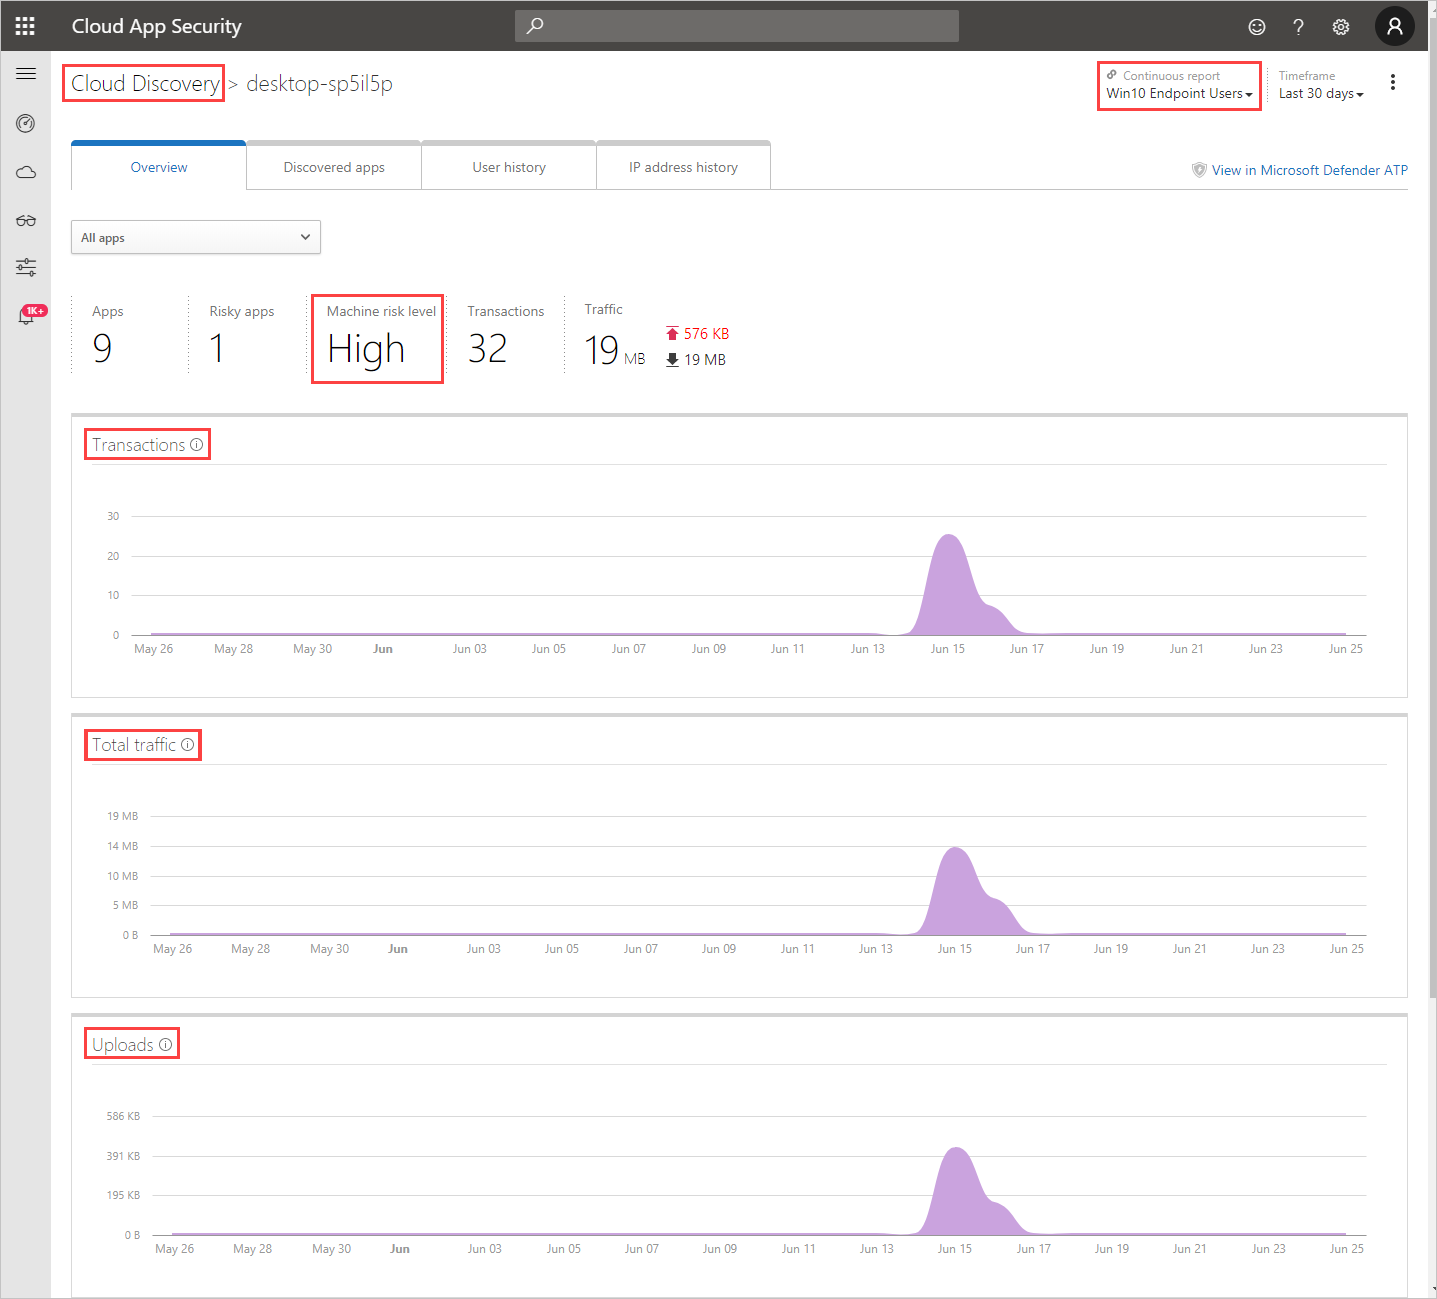
- Overview
As with any other Cloud Discovery source, you can export the data from the Win10 endpoint users report for further investigation.
Note
- Defender for Endpoint forwards data to Defender for Cloud Apps in chunks of ~4 MB (~4000 endpoint transactions)
- If the 4 MB limit isn’t reached within 1 hour, Defender for Endpoint reports all the transactions performed over the last hour.
- If the endpoint device is behind a forward proxy, traffic data will not be visible to Defender for Endpoint and hence will not be included in Cloud Discovery reports. We recommend to routing the forward proxy’s logs to Defender for Cloud Apps using the Automated log upload in order to get complete visibility. For an alternative way to view this traffic and investigate accessed URLs by devices behind the forward proxy, see Monitoring network connection behind forward proxy.
Investigate device network events in Microsoft 365 Defender
Note
Network events should be used to investigate discovered apps and not used to debug missing data.
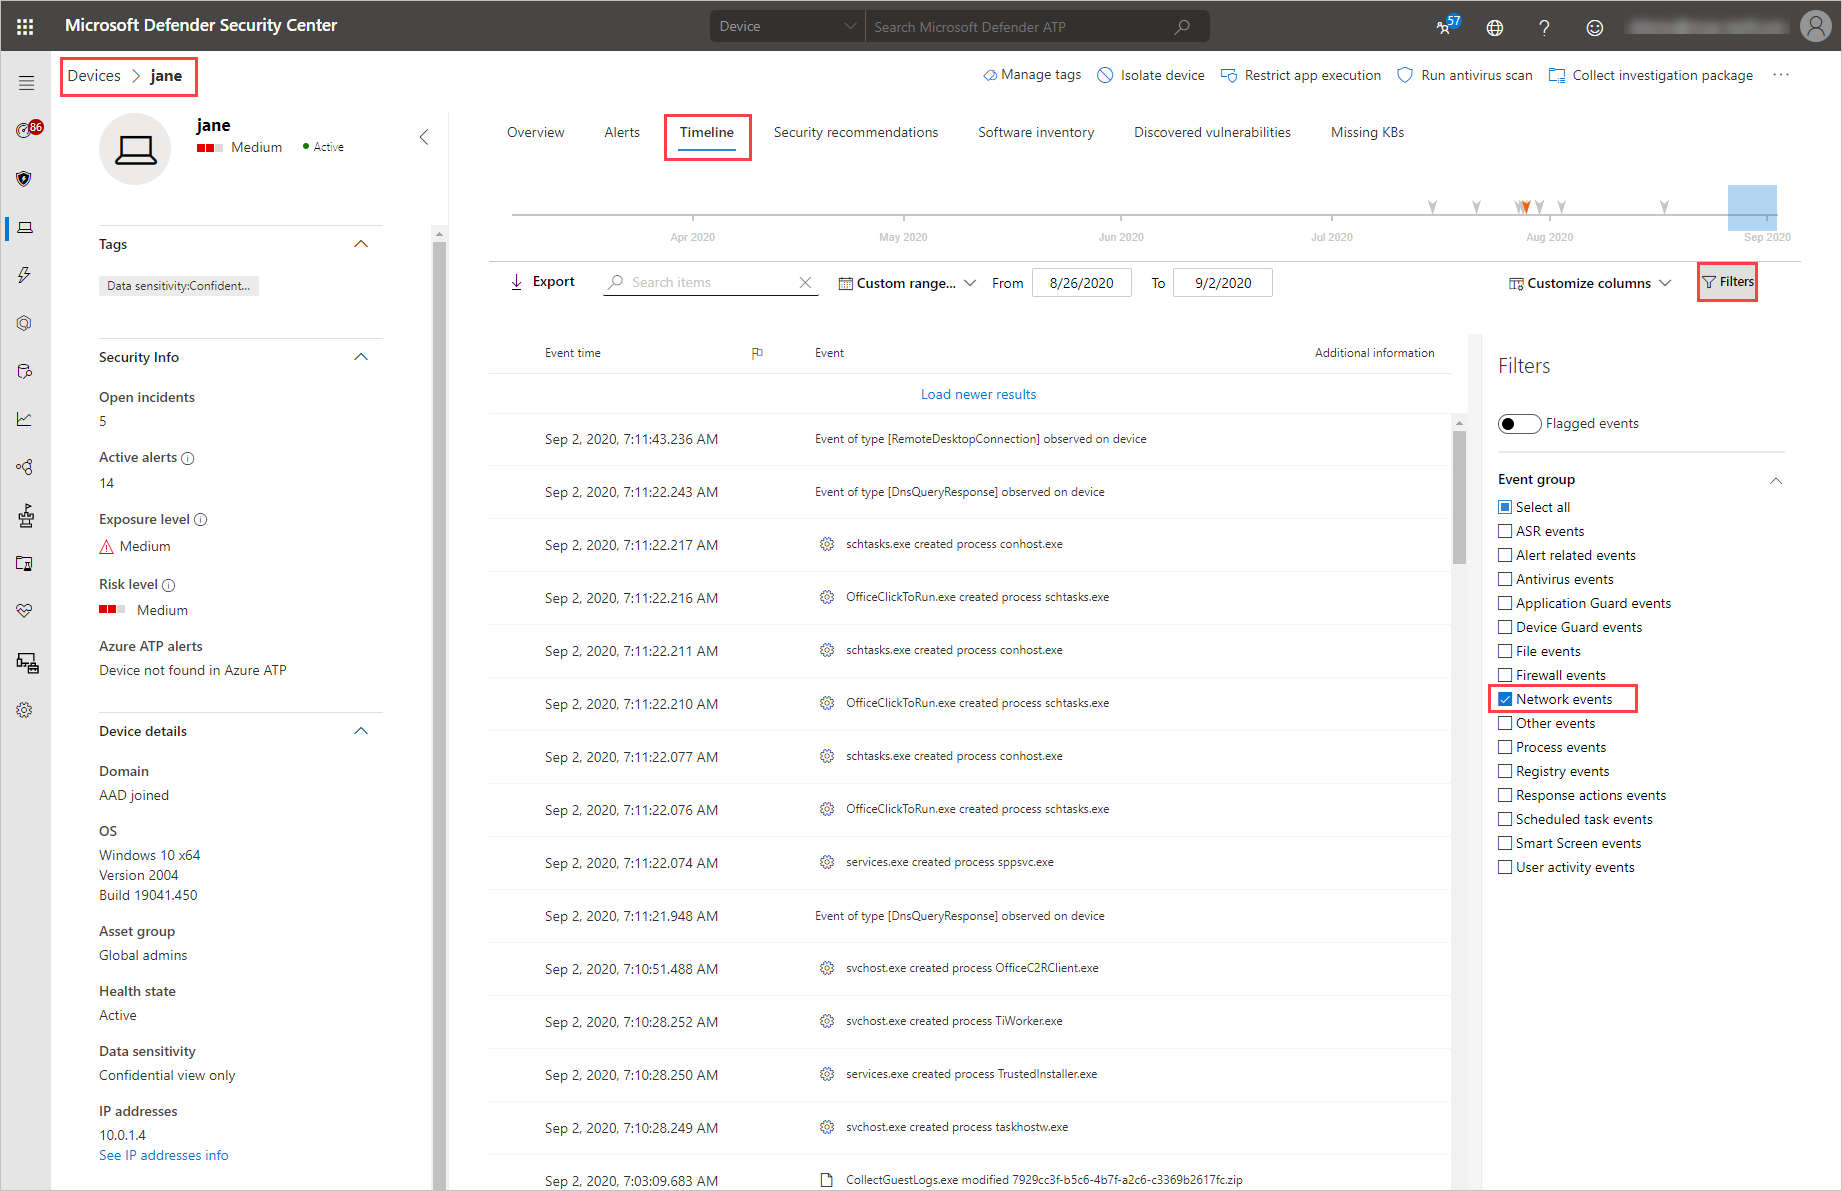
Use the following steps to gain more granular visibility on device’s network activity in Microsoft Defender for Endpoint:
- In Defender for Cloud Apps, under Discovery and then select Devices.
- Select the machine you want to investigate and then in the top-right select View in Microsoft Defender for Endpoint.
- In Microsoft 365 Defender, under Devices > {selected device}, select Timeline.
- Under Filters, select Network events.
- Investigate the device’s network events as required.
Investigate app usage in Microsoft 365 Defender with advanced hunting
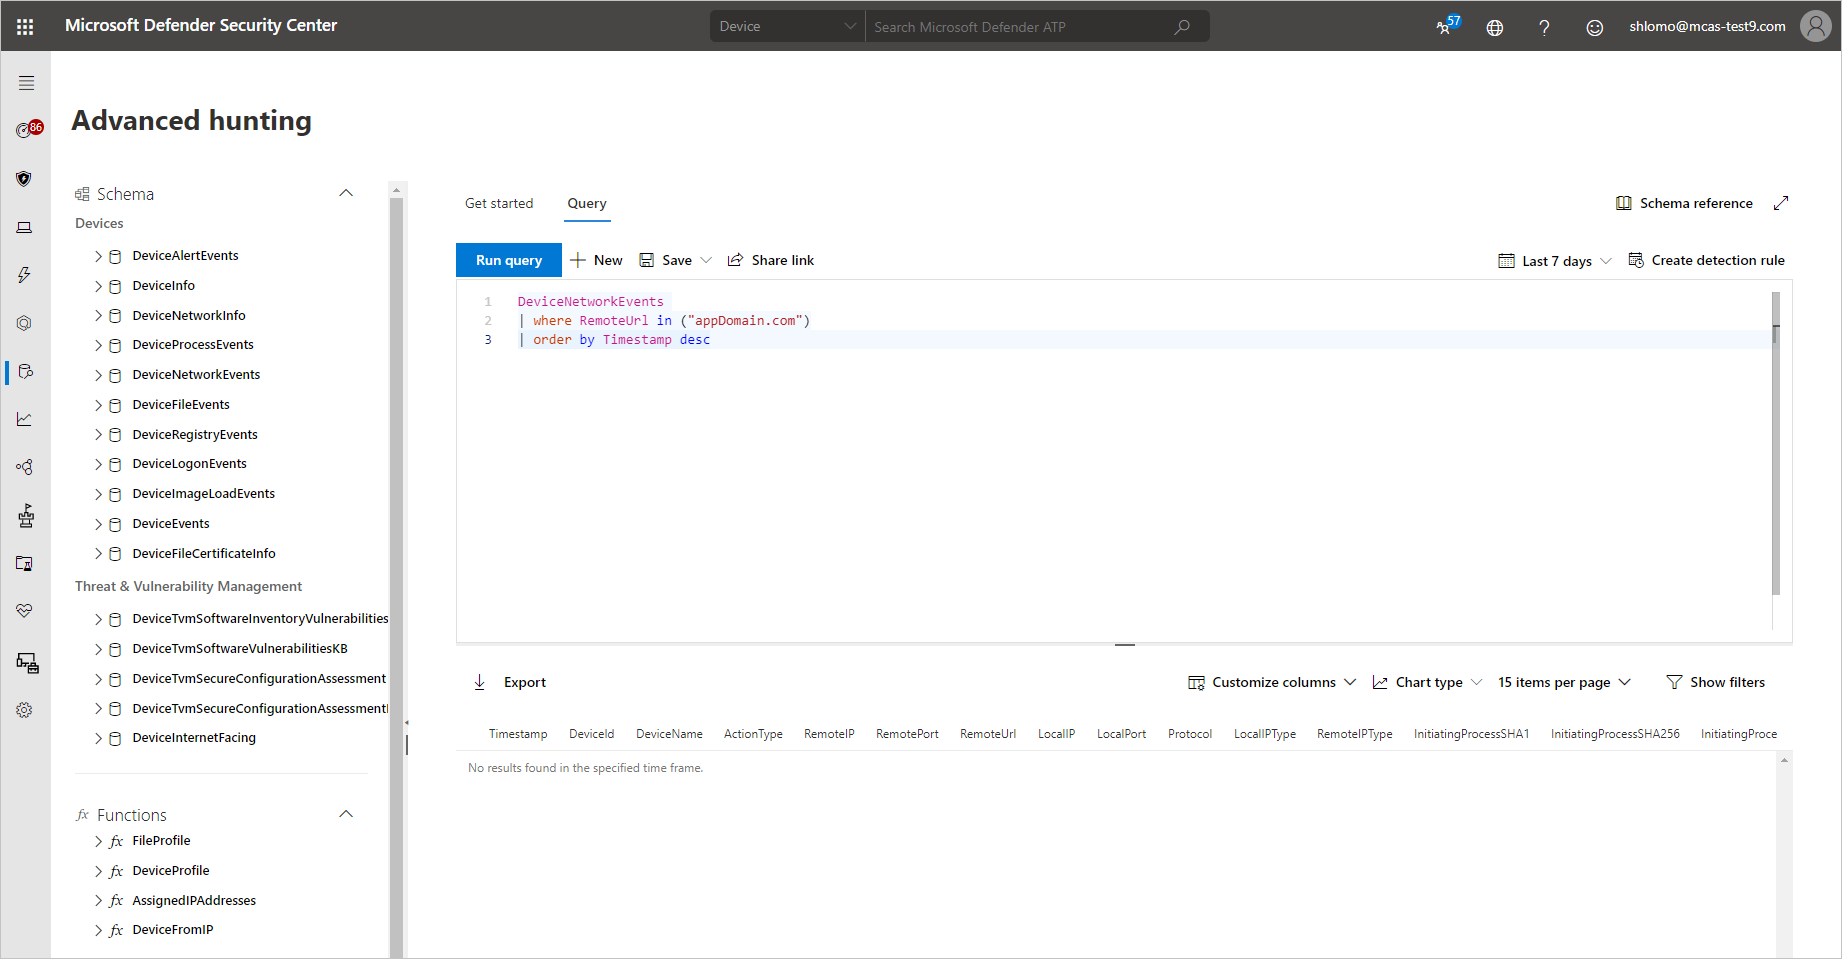
Use the following steps to gain more granular visibility on app-related network events in Defender for Endpoint:
- In Defender for Cloud Apps, under Discovery select Discovered apps.
- Select the app you want to investigate to open its drawer.
- Select the app’s Domain list and then copy the list of domains.
- In Microsoft 365 Defender, under Devices, select Advanced hunting.
- Paste the following query and replace
<DOMAIN_LIST>with the list of domains you copied earlier.KustoDeviceNetworkEvents | where RemoteUrl in ("<DOMAIN_LIST>") | order by Timestamp desc - Run the query and investigate network events for this app.
Investigate unsanctioned apps in Microsoft 365 Defender
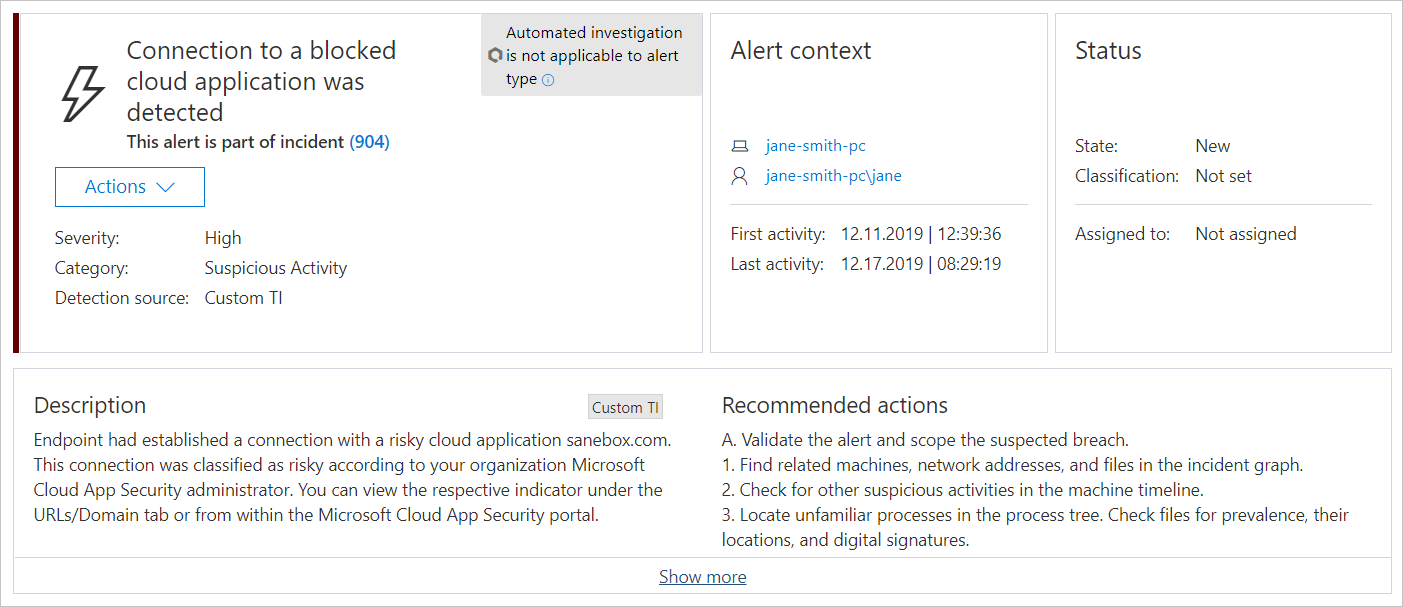
Every attempt to access an unsanctioned app triggers an alert in Microsoft 365 Defender with in-depth details about the entire session. This enables you to perform deeper investigations into attempts to access unsanctioned apps, as well as providing additional relevant information for use in endpoint device investigation.
Sometimes, access to an unsanctioned app isn’t blocked, either because the endpoint device isn’t configured correctly or if the enforcement policy hasn’t yet propagated to the endpoint. In this instance, Defender for Endpoint administrators will receive an alert in Microsoft 365 Defender that the unsanctioned app wasn’t blocked.
Note
- It takes up to two hours after you tag an app as Unsanctioned for app domains to propagate to endpoint devices.
- By default, apps and domains marked as Unsanctioned in Defender for Cloud Apps, will be blocked for all endpoint devices in the organization.
- Currently, full URLs are not supported for unsanctioned apps. Therefore, when unsanctioning apps configured with full URLs, they are not propagated to Defender for Endpoint and will not be blocked. For example,
google.com/driveis not supported, whiledrive.google.comis supported. - In-browser notifications may vary between different browsers.

