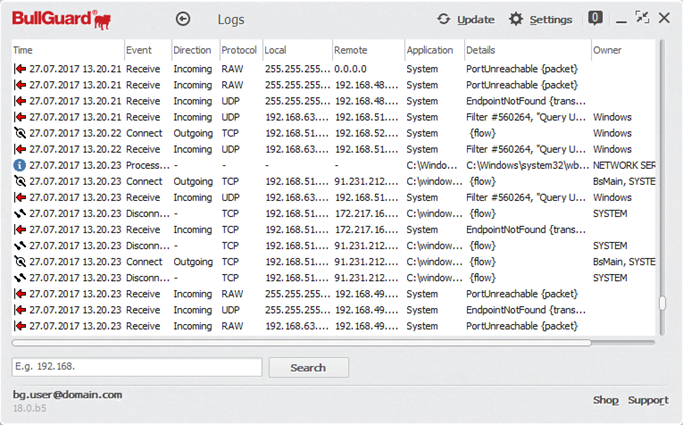
The Logs tab is a tabled, real-time and up-to-date integration of the traffic logs generated by the Firewall. It will show all the connections that have been active on your computer.
To access this tab, simply open BullGuard and select the Logs option by clicking on the  button from the Firewall section.

Time: the date and time when the event occurred.
Event: the type of event.
Direction: the traffic direction (incoming or outgoing).
Protocol: the protocol type (UDP, TCP, ICMP, IGMP, etc.) used by that specific connection. Local: the source IP address (the IP address of the computer that sent the specific packet).
Remote: the destination of the IP address (the local host).
Application: the executable file to which that specific connection/information packet belongs.
Details: the event details.
Owner: the event owner ID.
User interaction with logs
Right-clicking on any field in the log displays a contextual menu with several options.

A selection of Remote host tools are available: Ping (to check whether the computer is working – note that some computers may not respond to unsolicited pings), Tracert (will show the communication nodes to the selected IP) and Nslookup (requesting information regarding an IP address such as the host name for example).
Search by: allows you to filter the log by the Application System, IP Address or IP Port of the currently selected event. The filtering function can also be used my manually entering an application system, IP address or IP port in the search field and clicking Search.
Clear log: will delete all entries from the Firewall traffic log.
Export as text file: exports the table of logs as a .csv file
Explore application: allows you to explore the executable file folder to which a Firewall event may be attached.
Source : Official BullGuard Brand
Editor by : BEST Antivirus KBS Team

