

Important
The improved Microsoft 365 Defender portal is now available. This new experience brings Defender for Endpoint, Defender for Office 365, Microsoft 365 Defender, and more into the Microsoft 365 Defender portal. Learn what’s new.
Applies to:
- Microsoft 365 Defender
- Microsoft Defender for Endpoint
Important
Some information relates to prereleased product which may be substantially modified before it’s commercially released. Microsoft makes no warranties, express or implied, with respect to the information provided here.
While you can construct your advanced hunting queries to return very precise information, you can also work with the query results to gain further insight and investigate specific activities and indicators. You can take the following actions on your query results:
- View results as a table or chart
- Export tables and charts
- Drill down to detailed entity information
- Tweak your queries directly from the results or apply filters
View query results as a table or chart
By default, advanced hunting displays query results as tabular data. You can also display the same data as a chart. Advanced hunting supports the following views:
| View type | Description |
|---|---|
| Table | Displays the query results in tabular format |
| Column chart | Renders a series of unique items on the x-axis as vertical bars whose heights represent numeric values from another field |
| Stacked column chart | Renders a series of unique items on the x-axis as stacked vertical bars whose heights represent numeric values from one or more other fields |
| Pie chart | Renders sectional pies representing unique items. The size of each pie represents numeric values from another field. |
| Donut chart | Renders sectional arcs representing unique items. The length of each arc represents numeric values from another field. |
| Line chart | Plots numeric values for a series of unique items and connects the plotted values |
| Scatter chart | Plots numeric values for a series of unique items |
| Area chart | Plots numeric values for a series of unique items and fills the sections below the plotted values |
Construct queries for effective charts
When rendering charts, advanced hunting automatically identifies columns of interest and the numeric values to aggregate. To get meaningful charts, construct your queries to return the specific values you want to see visualized. Here are some sample queries and the resulting charts.
Alerts by severity
Use the summarize operator to obtain a numeric count of the values you want to chart. The query below uses the summarize operator to get the number of alerts by severity.
AlertInfo
| summarize Total = count() by Severity
When rendering the results, a column chart displays each severity value as a separate column:
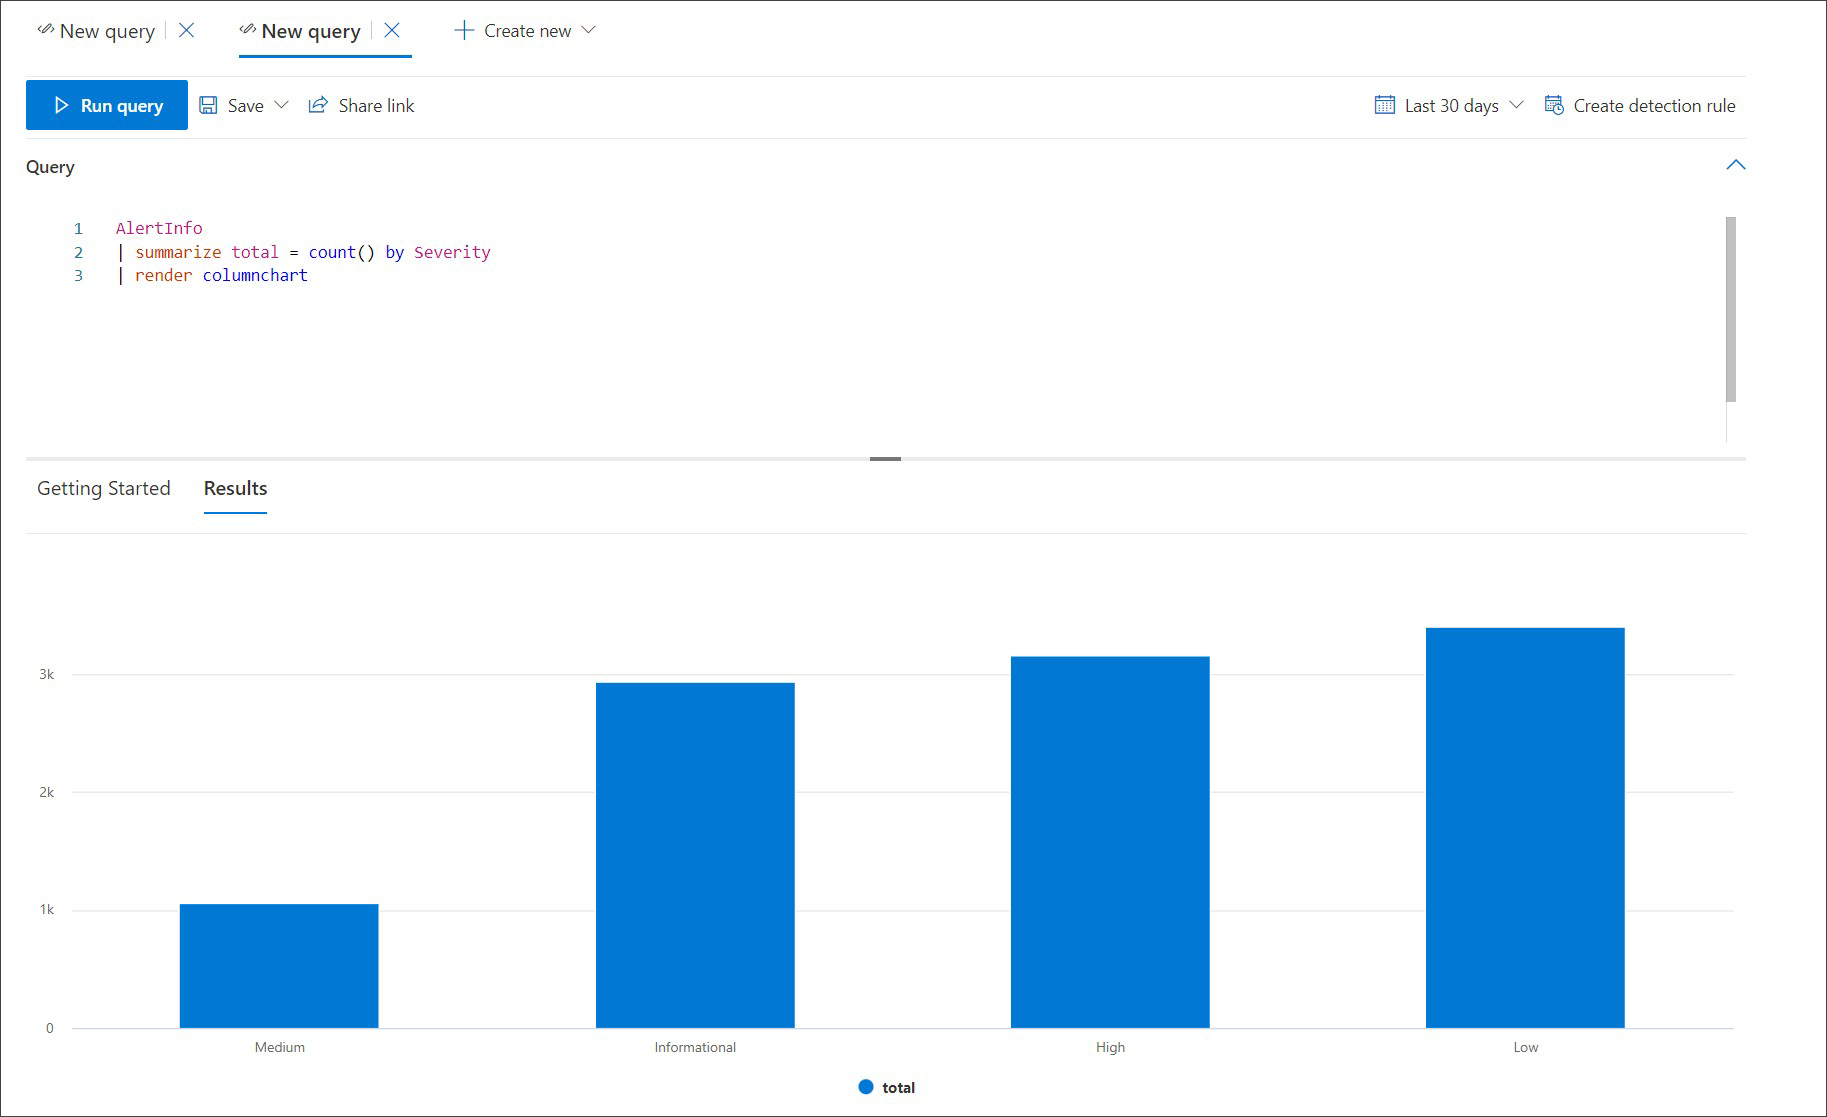 Query results for alerts by severity displayed as a column chart
Phishing emails across top ten sender domains
If you’re dealing with a list of values that isn’t finite, you can use the Top operator to chart only the values with the most instances. For example, to get the top ten sender domains with the most phishing emails, use the query below:
EmailEvents
| where ThreatTypes has "Phish"
| summarize Count = count() by SenderFromDomain
| top 10 by Count
Use the pie chart view to effectively show distribution across the top domains:
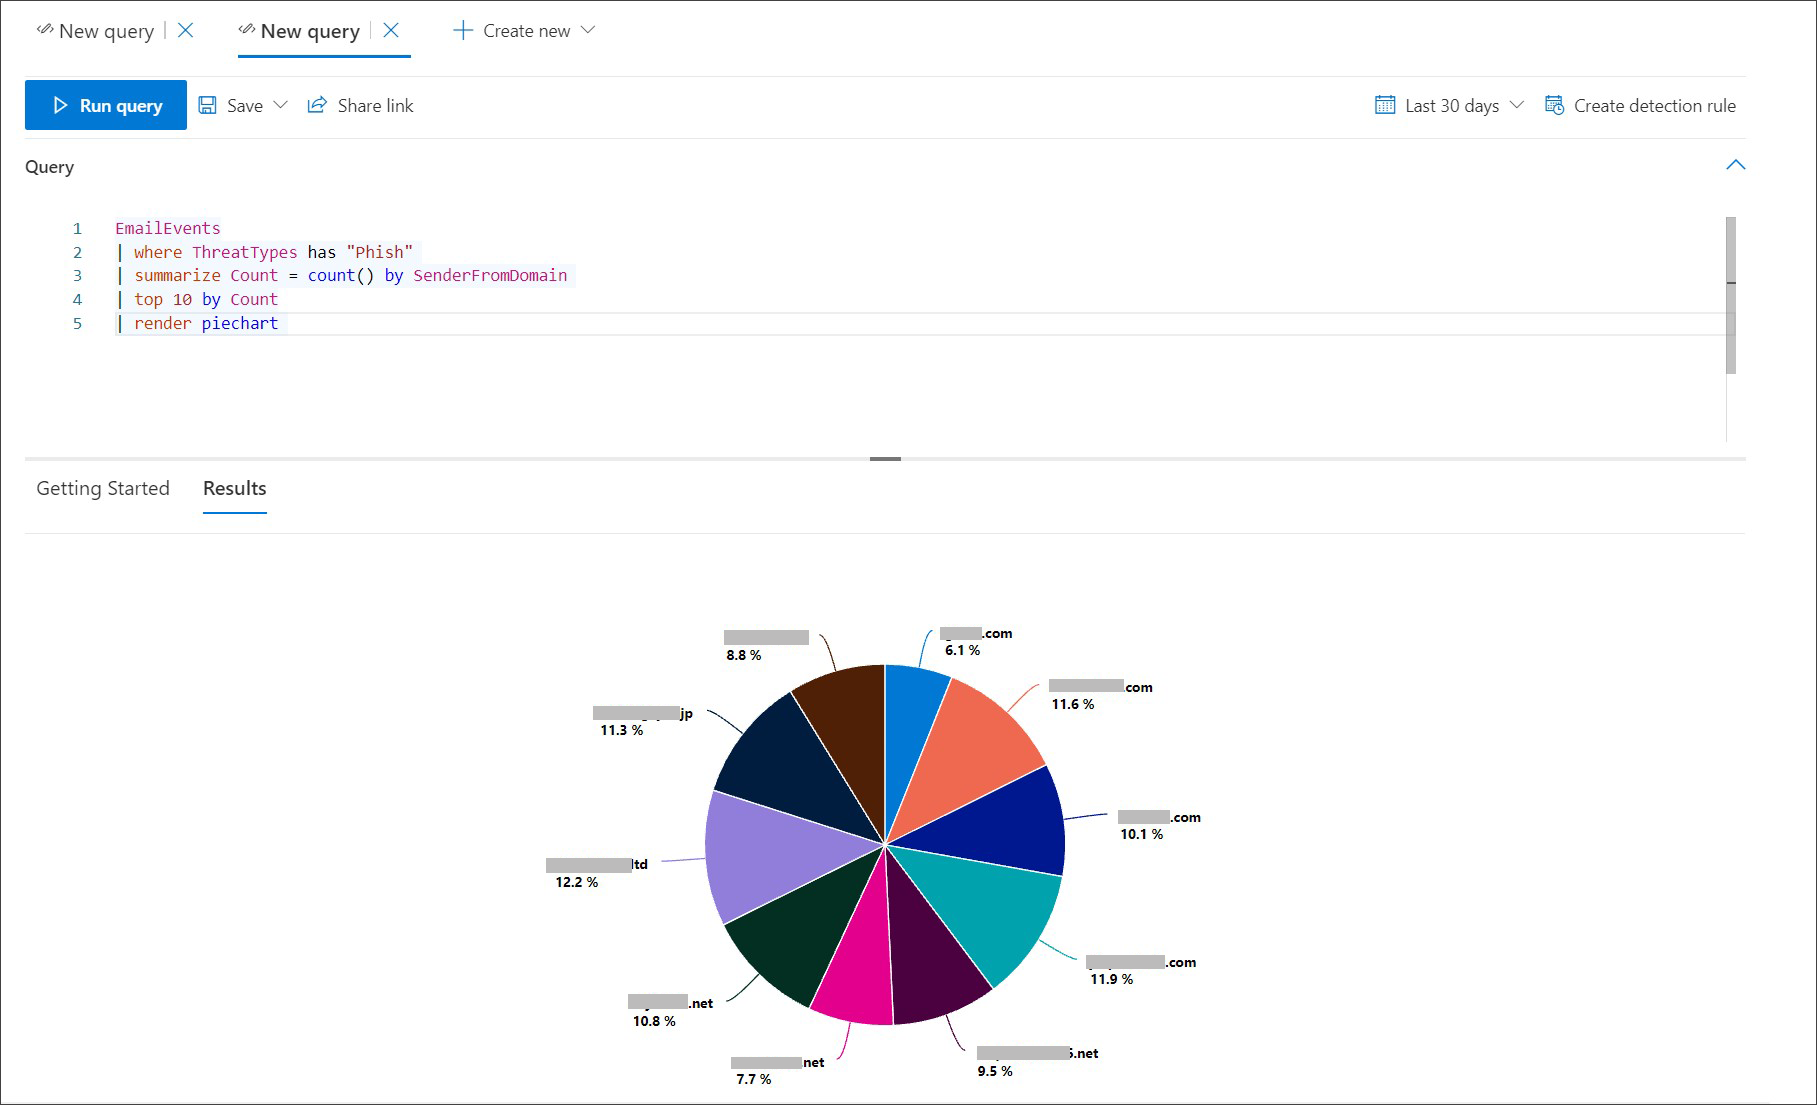 Pie chart showing distribution of phishing emails across top sender domains
File activities over time
Using the summarize operator with the bin() function, you can check for events involving a particular indicator over time. The query below counts events involving the file invoice.doc at 30 minute intervals to show spikes in activity related to that file:
CloudAppEvents
| union DeviceFileEvents
| where FileName == "invoice.doc"
| summarize FileCount = count() by bin(Timestamp, 30m)
The line chart below clearly highlights time periods with more activity involving invoice.doc:
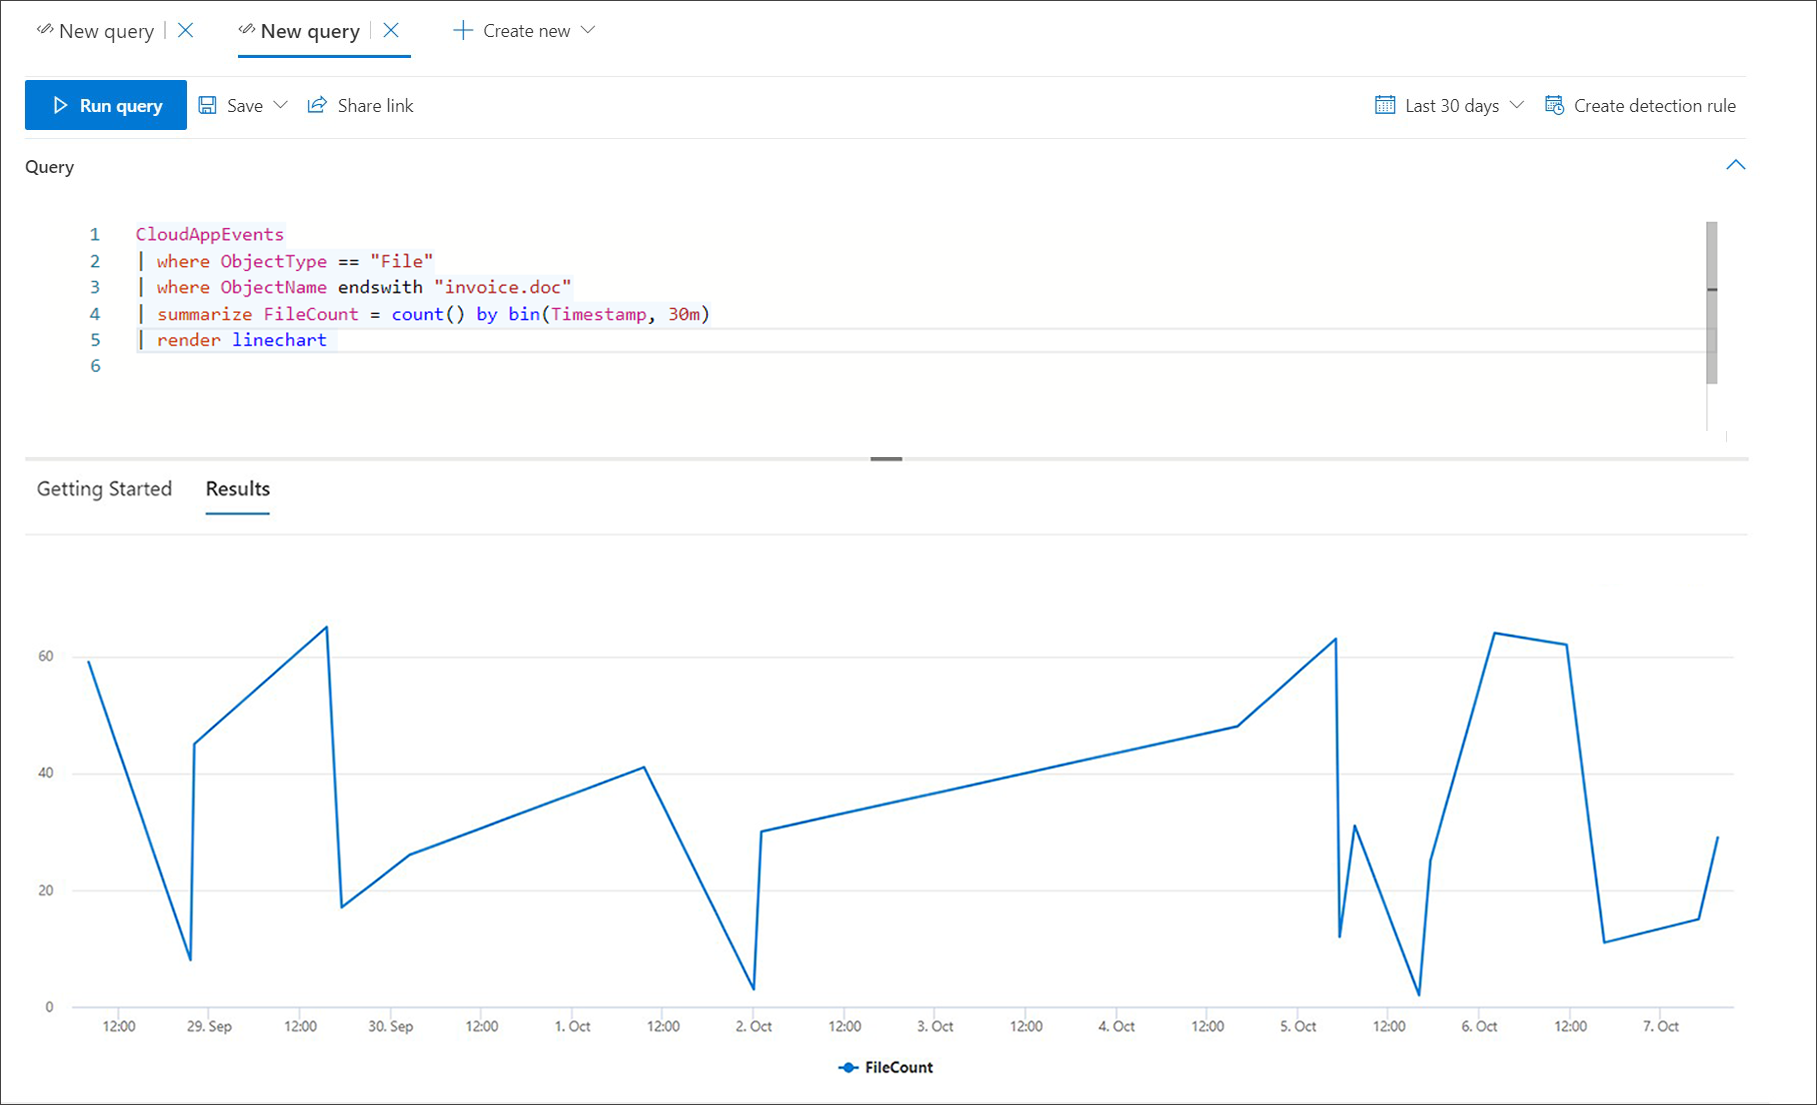 Line chart showing the number of events involving a file over time
Export tables and charts
After running a query, select Export to save the results to local file. Your chosen view determines how the results are exported:
- Table view — the query results are exported in tabular form as a Microsoft Excel workbook
- Any chart — the query results are exported as a JPEG image of the rendered chart
Drill down from query results
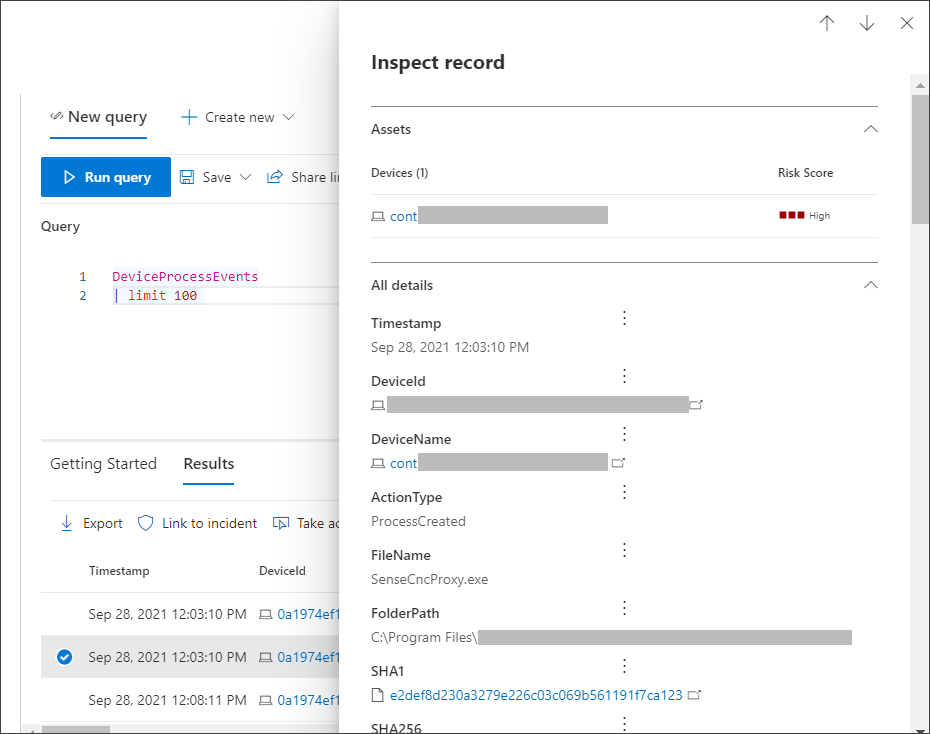
To quickly inspect a record in your query results, select the corresponding row to open the Inspect record panel. The panel provides the following information based on the selected record:
- Assets — summarized view of the main assets (mailboxes, devices, and users) found in the record, enriched with available information, such as risk and exposure levels
- All details — all the values from the columns in the record
To view more information about a specific entity in your query results, such as a machine, file, user, IP address, or URL, select the entity identifier to open a detailed profile page for that entity.
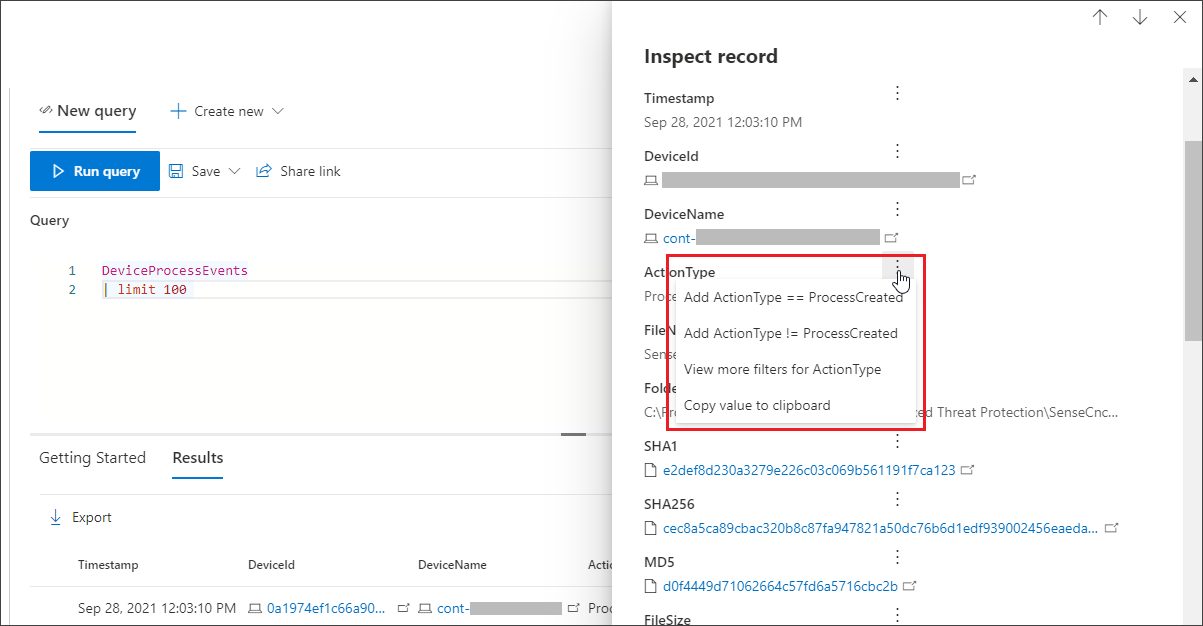
Tweak your queries from the results
Select the three dots to the right of any column in the Inspect record panel. You can use the options to:
- Explicitly look for the selected value (
==) - Exclude the selected value from the query (
!=) - Get more advanced operators for adding the value to your query, such as
contains,starts withandends with
Note
Some tables in this article might not be available in Microsoft Defender for Endpoint. Turn on Microsoft 365 Defender to hunt for threats using more data sources. You can move your advanced hunting workflows from Microsoft Defender for Endpoint to Microsoft 365 Defender by following the steps in Migrate advanced hunting queries from Microsoft Defender for Endpoint.