Investigate the details of a file associated with a specific alert, behavior, or event to help determine if the file exhibits malicious activities, identify the attack motivation, and understand the potential scope of the breach.
There are many ways to access the detailed profile page of a specific file. For example, you can use the search feature, click on a link from the Alert process tree, Incident graph, Artifact timeline, or select an event listed in the Device timeline.
Once on the detailed profile page, you can switch between the new and old page layouts by toggling new File page. The rest of this article describes the newer page layout.
You can get information from the following sections in the file view:
- File details, Malware detection, File prevalence
- Deep analysis
- Alerts
- Observed in organization
- Deep analysis
- File names
You can also take action on a file from this page.
File actions
Along the top of the profile page, above the file information cards. Actions you can perform here include:
- Stop and quarantine
- Add/edit indicator
- Download file
- Consult a threat expert
- Action center
For more information on these actions, see Take response action on a file.
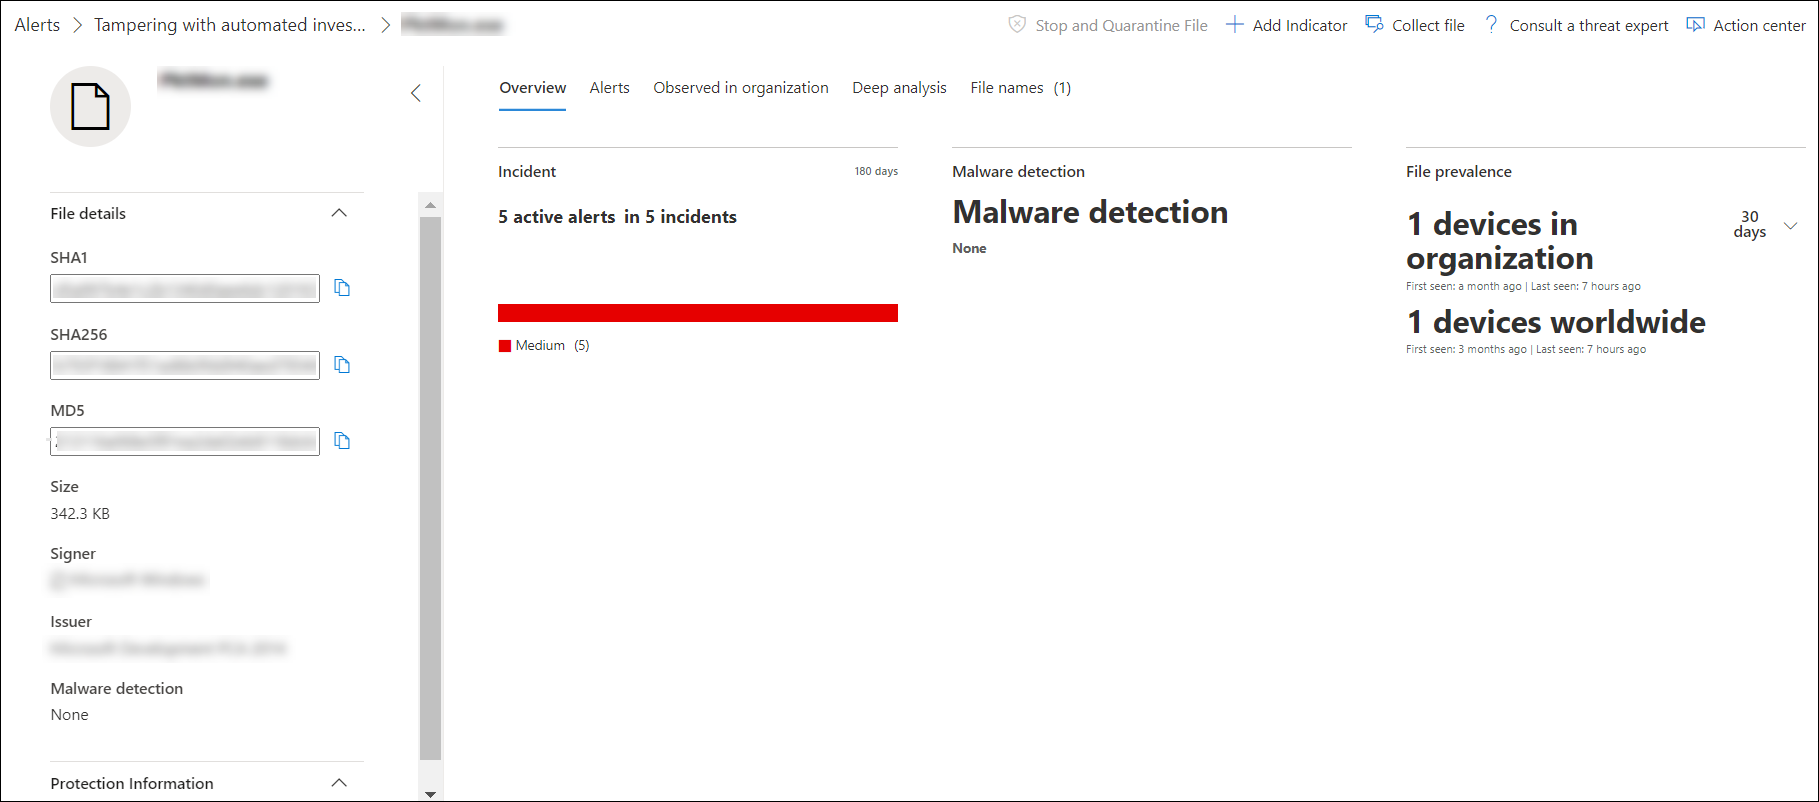
File details, Malware detection, and File prevalence
The file details, incident, malware detection, and file prevalence cards display various attributes about the file.
You’ll see details such as the file’s MD5, the Virus Total detection ratio, and Microsoft Defender AV detection if available, and the file’s prevalence.
The file prevalence card shows where the file was seen in devices in the organization and worldwide.
Note
Different users may see dissimilar values in the devices in organization section of the file prevalence card. This is because the card displays information based on the RBAC scope that a user has. Meaning, if a user has been granted visibility on a specific set of devices, they will only see the file organizational prevalence on those devices.

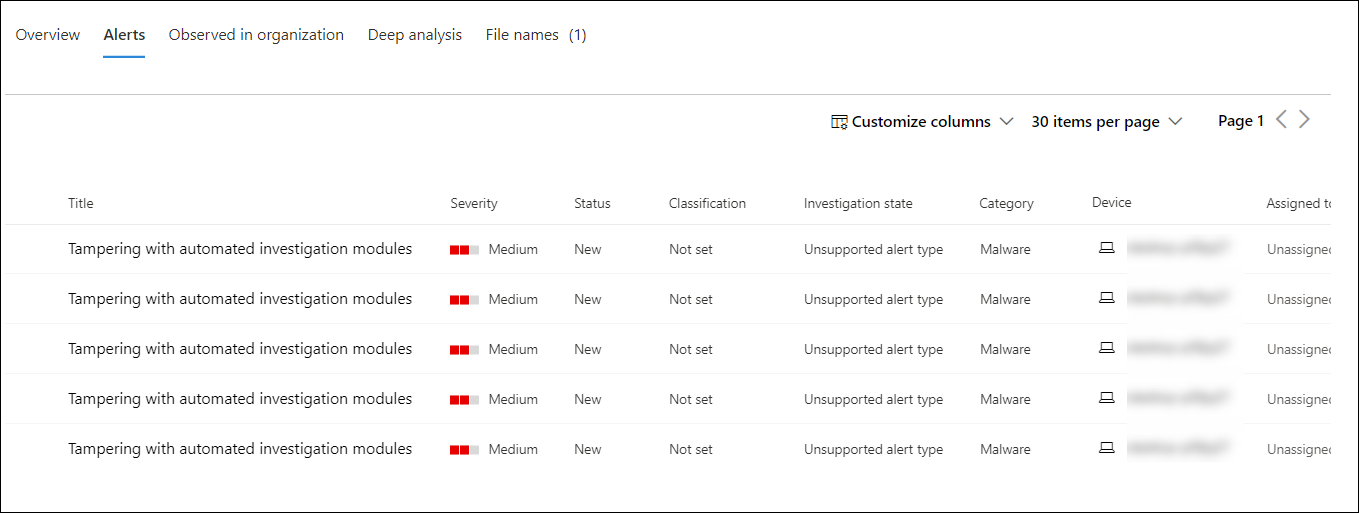
Alerts
The Alerts tab provides a list of alerts that are associated with the file. This list covers much of the same information as the Alerts queue, except for the device group, if any, the affected device belongs to. You can choose what kind of information is shown by selecting Customize columns from the toolbar above the column headers.

Observed in organization
The Observed in organization tab allows you to specify a date range to see which devices have been observed with the file.
Note
This tab will show a maximum number of 100 devices. To see all devices with the file, export the tab to a CSV file, by selecting Export from the action menu above the tab’s column headers.

Use the slider or the range selector to quickly specify a time period that you want to check for events involving the file. You can specify a time window as small as a single day. This will allow you to see only files that communicated with that IP Address at that time, drastically reducing unnecessary scrolling and searching.
Deep analysis
The Deep analysis tab allows you to submit the file for deep analysis, to uncover more details about the file’s behavior, as well as the effect it is having within your organizations. After you submit the file, the deep analysis report will appear in this tab once results are available. If deep analysis did not find anything, the report will be empty and the results space will remain blank.

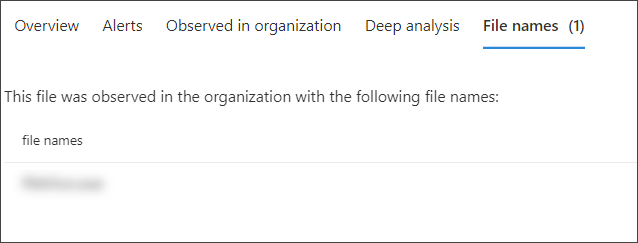
File names
The File names tab lists all names the file has been observed to use, within your organizations.


