If you are an admin, you can now host firewall reporting to the Microsoft 365 Defender portal. This feature enables you to view Windows 10, Windows 11, Windows Server 2019, and Windows Server 2022 firewall reporting from a centralized location.
What do you need to know before you begin?
- You must be running Windows 10 or Windows 11, or Windows Server 2019, or Windows Server 2022.
- To onboard devices to the Microsoft Defender for Endpoint service, see here.
- For Microsoft 365 Defender portal to start receiving the data, you must enable Audit Events for Windows Defender Firewall with Advanced Security:
- Enable these events by using Group Policy Object Editor, Local Security Policy, or the auditpol.exe commands. For more information, see here.
- The two PowerShell commands are:
- auditpol /set /subcategory:”Filtering Platform Packet Drop” /failure:enable
- auditpol /set /subcategory:”Filtering Platform Connection” /failure:enable
- The two PowerShell commands are:
The process
Note
Make sure to follow the instructions from the section above and properly configure your devices for the early preview participation.
- After enabling the events, Microsoft 365 Defender will start to monitor the data.
- Remote IP, Remote Port, Local Port, Local IP, Computer Name, Process across inbound and outbound connections.
- Admins can now see Windows host firewall activity here.
- Additional reporting can be facilitated by downloading the Custom Reporting script to monitor the Windows Defender Firewall activities using Power BI.
- It can take up to 12 hours before the data is reflected.
Supported scenarios
The following scenarios are supported during Ring0 Preview.
Firewall reporting
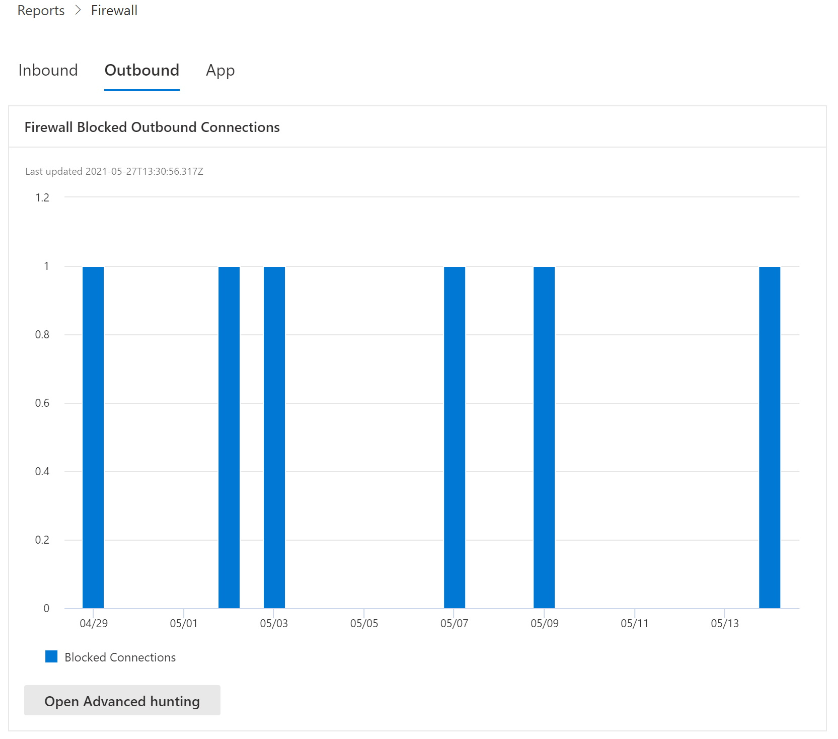
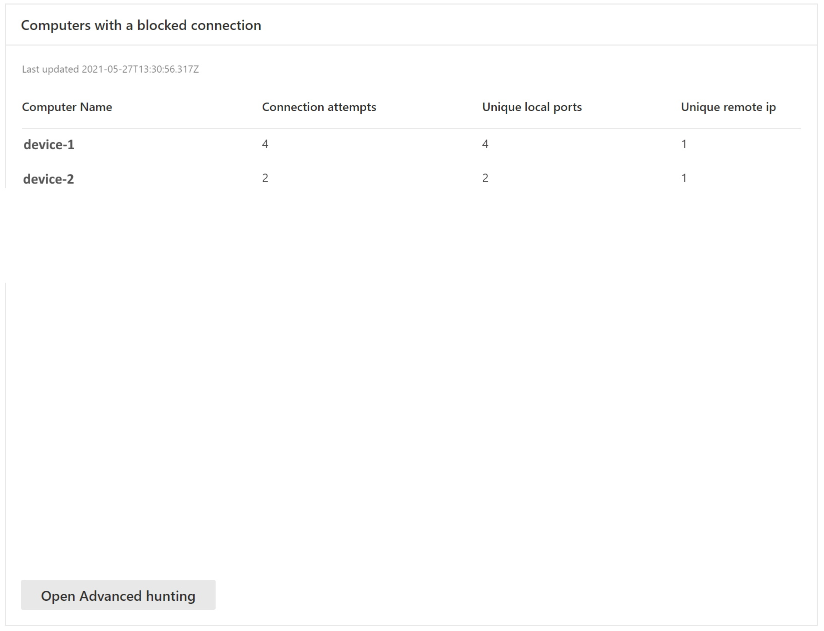
Here is a couple of examples of the firewall report pages. Here you will find a summary of inbound, outbound, and application activity. You can access this page directly by going to https://security.microsoft.com/firewall.

These reports can also be accessed by going to Reports > Security Report > Devices (section) located at the bottom of the Firewall Blocked Inbound Connections card.
From “Computers with a blocked connection” to device
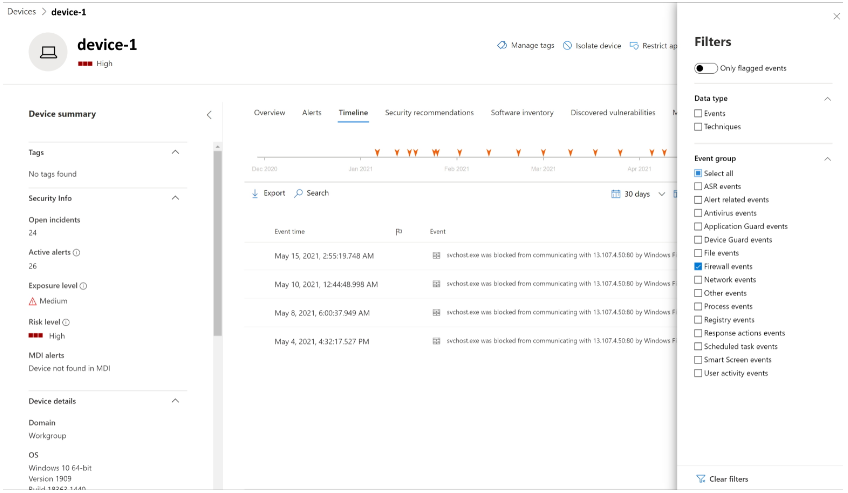
Cards support interactive objects. You can drill into the activity of a device by clicking on the device name, which will launch the Microsoft 365 Defender portal in a new tab, and take you directly to the Device Timeline tab.

You can now select the Timeline tab, which will give you a list of events associated with that device.
After clicking on the Filters button on the upper right-hand corner of the viewing pane, select the type of event you want. In this case, select Firewall events and the pane will be filtered to Firewall events.

Drill into advanced hunting (preview refresh)
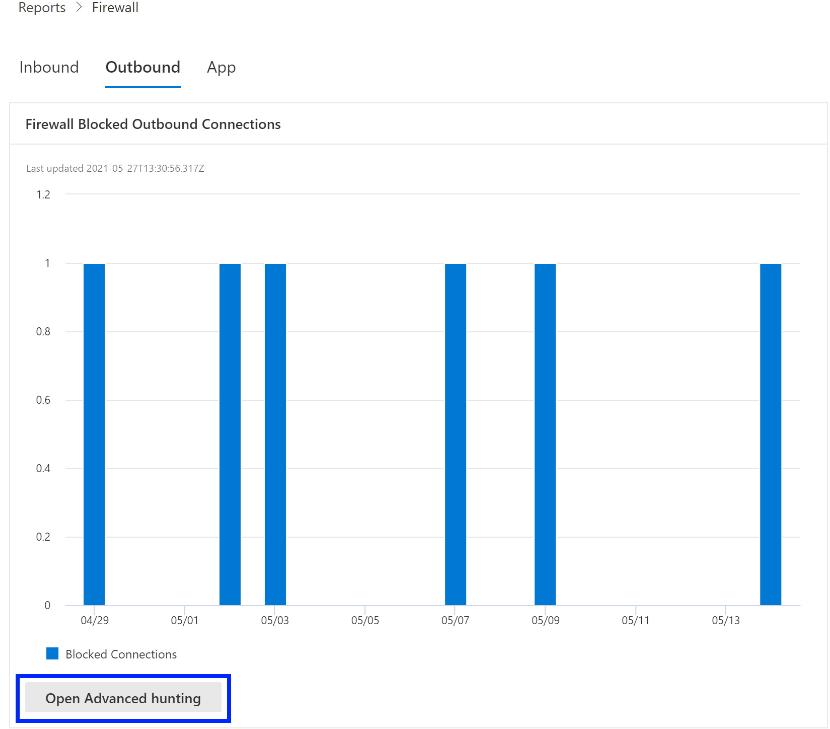
Firewall reports support drilling from the card directly into Advanced Hunting by clicking the Open Advanced hunting button. The query will be pre-populated.

The query can now be executed, and all related Firewall events from the last 30 days can be explored.
For additional reporting, or custom changes, the query can be exported into Power BI for further analysis. Custom reporting can be facilitated by downloading the Custom Reporting script to monitor the Windows Defender Firewall activities using Power BI.

