

The Security operations dashboard is where the endpoint detection and response capabilities are surfaced. It provides a high level overview of where detections were seen and highlights where response actions are needed.
The dashboard displays a snapshot of:
- Active alerts
- Devices at risk
- Sensor health
- Service health
- Daily devices reporting
- Active automated investigations
- Automated investigations statistics
- Users at risk
- Suspicious activities
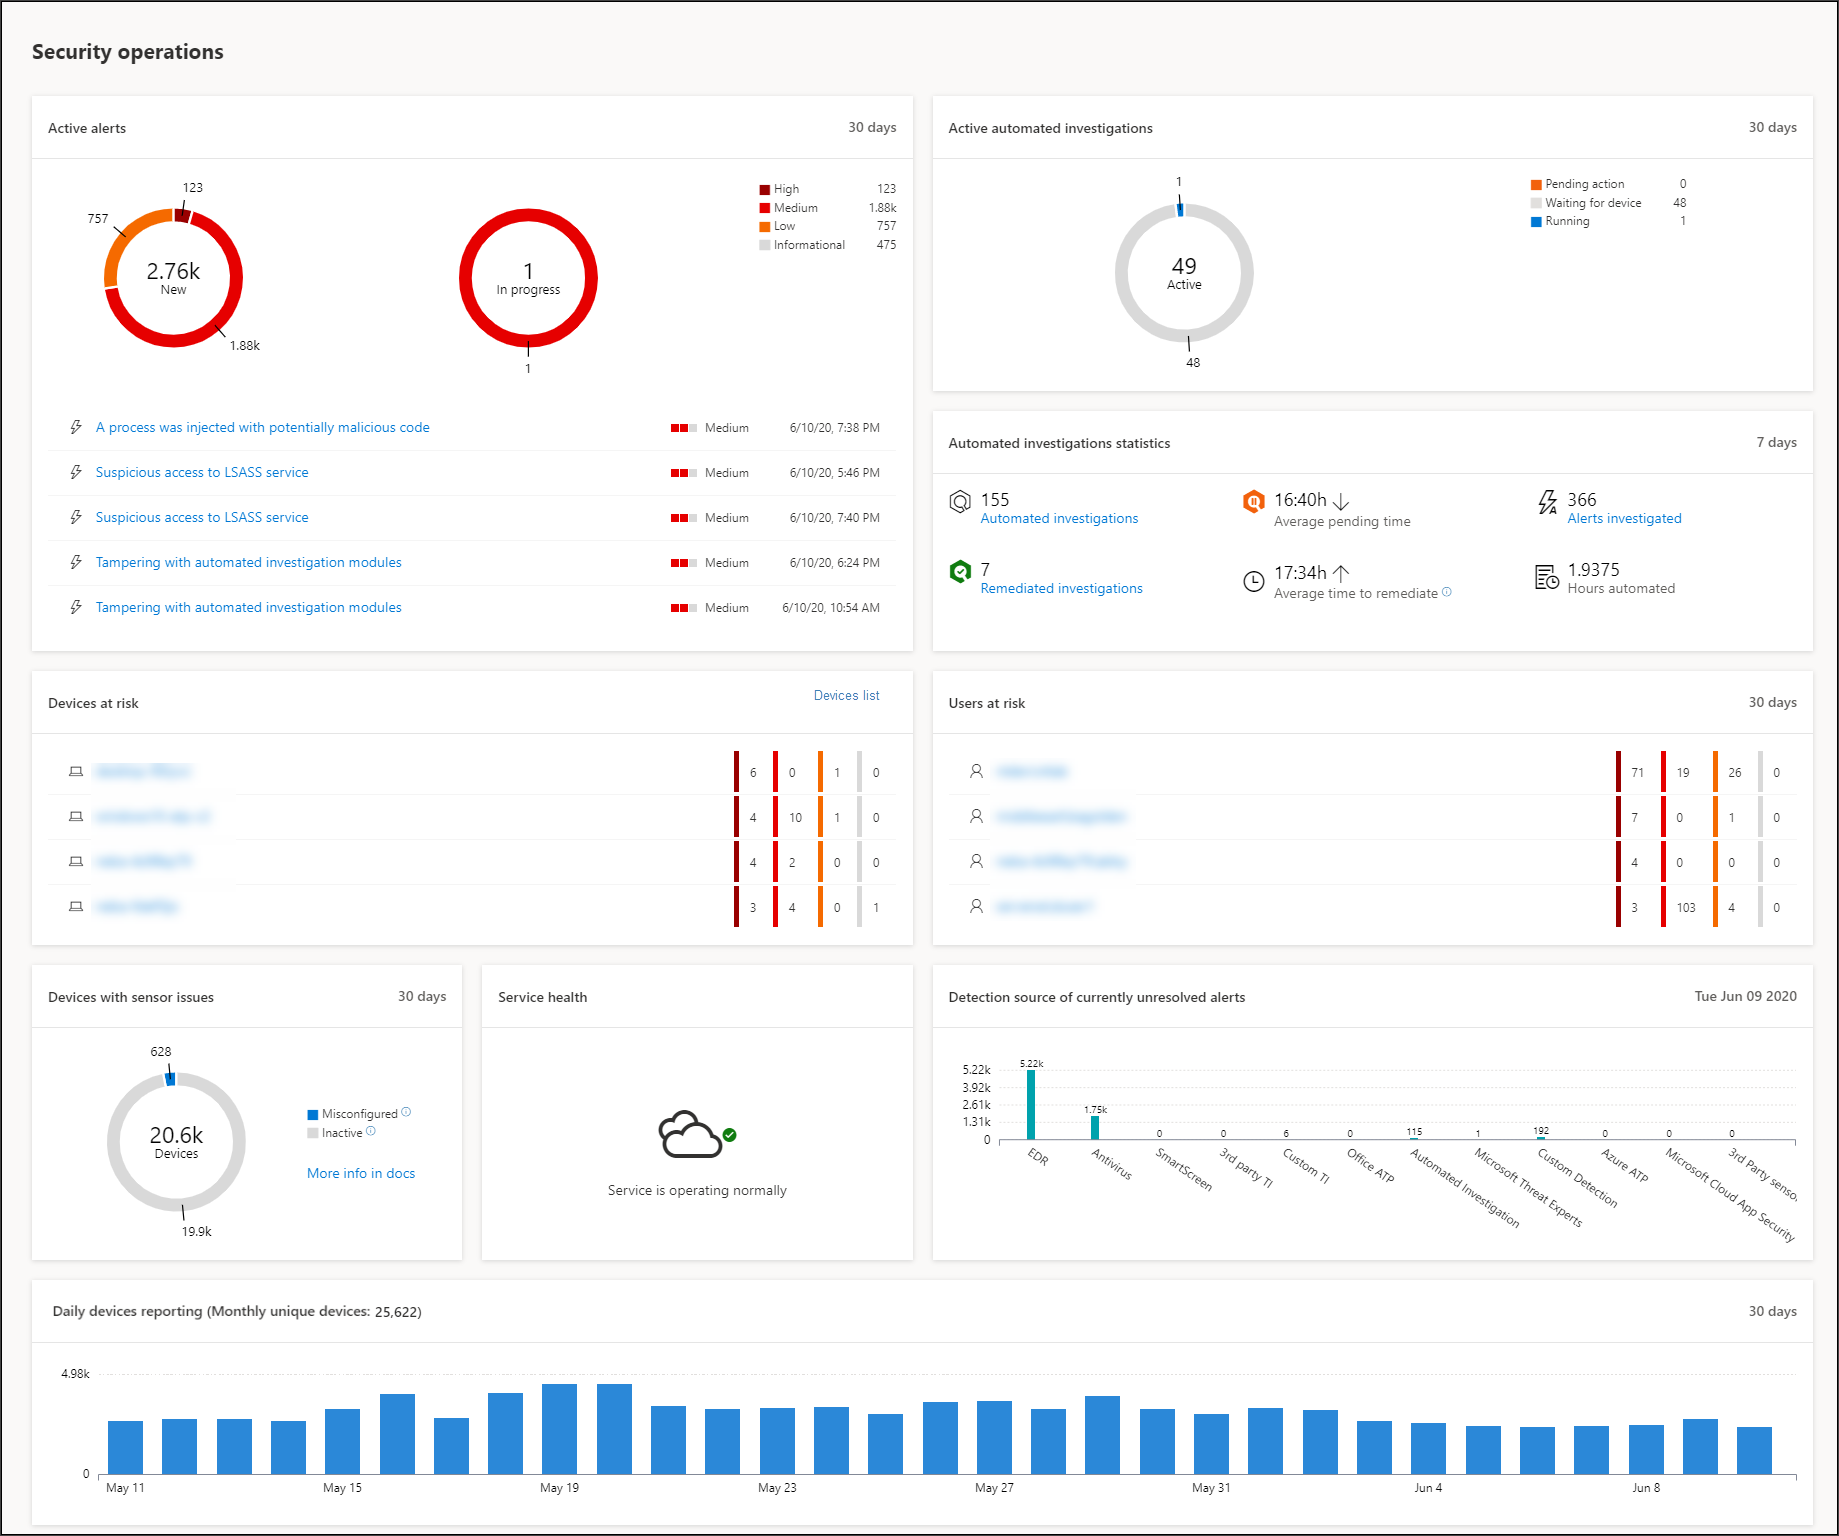
You can explore and investigate alerts and devices to quickly determine if, where, and when suspicious activities occurred in your network to help you understand the context they appeared in.
From the Security operations dashboard you will see aggregated events to facilitate the identification of significant events or behaviors on a device. You can also drill down into granular events and low-level indicators.
It also has clickable tiles that give visual cues on the overall health state of your organization. Each tile opens a detailed view of the corresponding overview.
Active alerts
You can view the overall number of active alerts from the last 30 days in your network from the tile. Alerts are grouped into New and In progress.
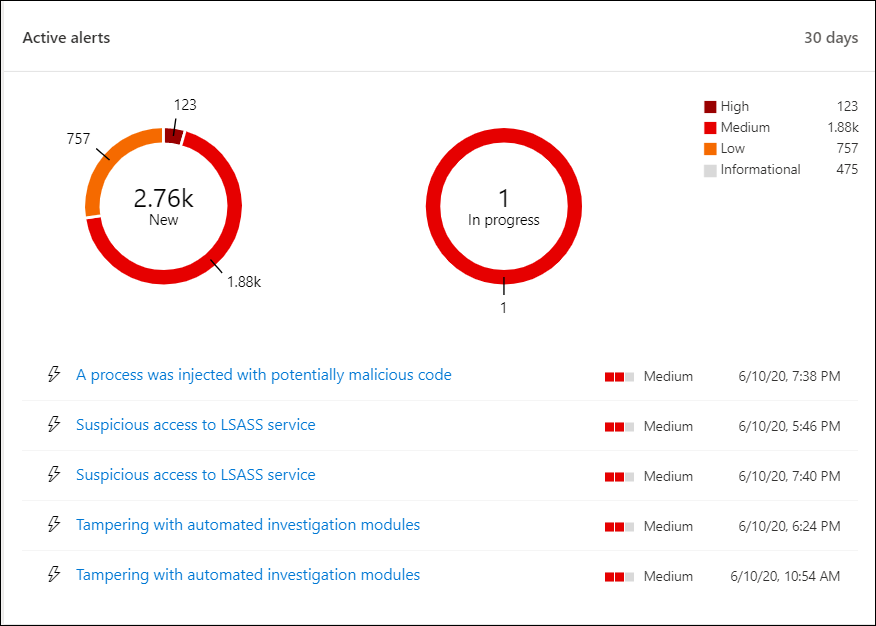
Each group is further sub-categorized into their corresponding alert severity levels. Click the number of alerts inside each alert ring to see a sorted view of that category’s queue (New or In progress).
For more information see, Alerts overview.
Each row includes an alert severity category and a short description of the alert. You can click an alert to see its detailed view. For more information see, Investigate Microsoft Defender for Endpoint alerts and Alerts overview.
Devices at risk
This tile shows you a list of devices with the highest number of active alerts. The total number of alerts for each device is shown in a circle next to the device name, and then further categorized by severity levels at the far end of the tile (hover over each severity bar to see its label).
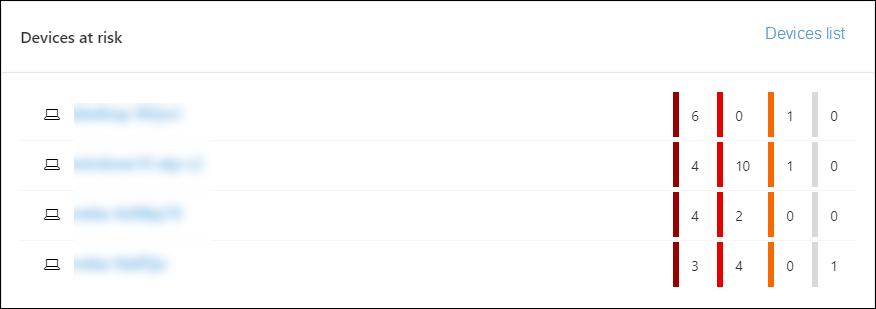
Click the name of the device to see details about that device. For more information see, Investigate devices in the Microsoft Defender for Endpoint Devices list.
You can also click Devices list at the top of the tile to go directly to the Devices list, sorted by the number of active alerts. For more information see, Investigate devices in the Microsoft Defender for Endpoint Devices list.
Devices with sensor issues
The Devices with sensor issues tile provides information on the individual device’s ability to provide sensor data to the Microsoft Defender for Endpoint service. It reports how many devices require attention and helps you identify problematic devices.
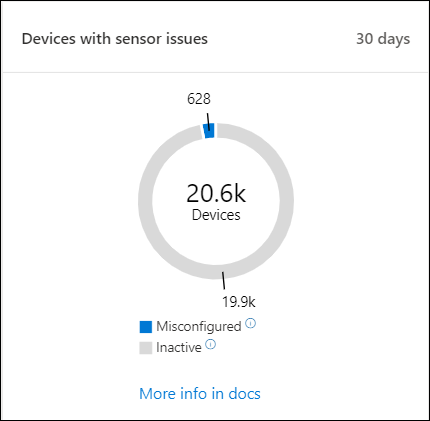
There are two status indicators that provide information on the number of devices that are not reporting properly to the service:
- Misconfigured: These devices might partially be reporting sensor data to the Microsoft Defender for Endpoint service and might have configuration errors that need to be corrected.
- Inactive: Devices that have stopped reporting to the Microsoft Defender for Endpoint service for more than seven days in the past month.
When you click any of the groups, you’ll be directed to devices list, filtered according to your choice. For more information, see Check sensor state and Investigate devices.
Service health
The Service health tile informs you if the service is active or if there are issues.
For more information on the service health, see Check the Microsoft Defender for Endpoint service health.
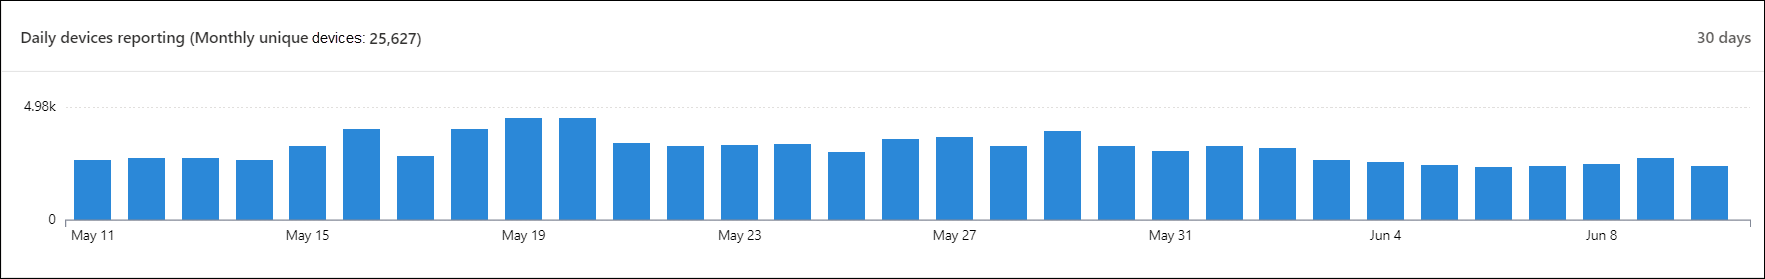
Daily devices reporting
The Daily devices reporting tile shows a bar graph that represents the number of devices reporting daily in the last 30 days. Hover over individual bars on the graph to see the exact number of devices reporting in each day.
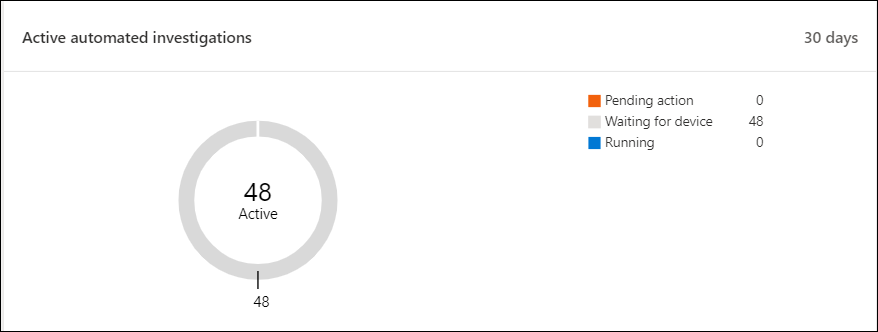
Active automated investigations
You can view the overall number of automated investigations from the last 30 days in your network from the Active automated investigations tile. Investigations are grouped into Pending action, Waiting for device, and Running.
Automated investigations statistics
This tile shows statistics related to automated investigations in the last seven days. It shows the number of investigations completed, the number of successfully remediated investigations, the average pending time it takes for an investigation to be initiated, the average time it takes to remediate an alert, the number of alerts investigated, and the number of hours of automation saved from a typical manual investigation.
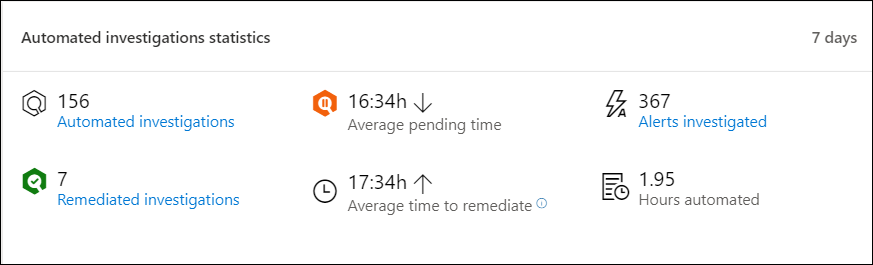
You can click on Automated investigations, Remediated investigations, and Alerts investigated to navigate to the Investigations page, filtered by the appropriate category. This lets you see a detailed breakdown of investigations in context.
Users at risk
The tile shows you a list of user accounts with the most active alerts and the number of alerts seen on high, medium, or low alerts.
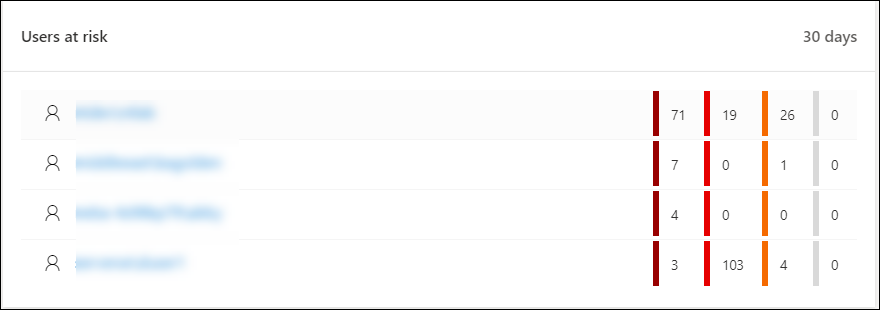
Click the user account to see details about the user account. For more information see Investigate a user account.
Want to experience Microsoft Defender for Endpoint? Sign up for a free trial.