
The Detections section in Malwarebytes Nebula displays information on all threats, and potential threats, found on the endpoints in your environment. You can see the number of daily detections within the last 30 days, and a record of the total detections and their endpoint locations on this page.
To view this section in the Nebula console, click Detections in the left-side pane. In the top-right, you can filter detections by the following: All Endpoint Types, Servers, and Workstations.
View and sort detections
The main area of the Detections screen shows the list of all detected threat data. Each column can be filtered to narrow the results. Use these column filters to focus on the most important information.
You can customize data in the results list in the following ways:
- Click Add / Remove Columns above the results list to choose which columns to display.
- Drag and drop certain column headers to the results bar to group data by those parameters.
- Use the filters
 in the column headers to view specific data.
 - Hover your cursor over a column header to reveal a hamburger icon
 with options to pin and auto-size columns.
You can filter the following columns:
- Name: Use this filter to search for a detection by name.
- Action Taken: Use this filter to sort by blocked, found, quarantined, deleted, or restored detections.
- Category: Use this filter to sort by malware, PUP, PUM, exploit, ransomware, remote intrusion, or website detections.
- Type: Use this filter to sort by exploit, extension, file, folder, inbound connection, module, outbound connection, process, registry key, or registry value.
- Endpoint: Use this filter to search for an endpoint name.
- Location: Use this filter to search for a web address, IP address, or file location.
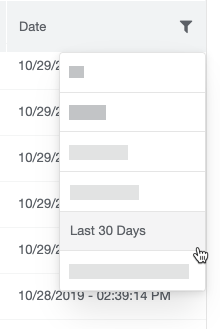
- Date: Use filter to sort by today, yesterday, last 7 days, last 30 days, or a custom date range.
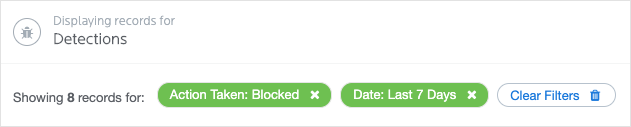
When clicking on filters, the filter list in the middle of the screen shows which filters are applied. Click on a filtered item to remove it, or Clear Filters to remove them all.
Expand detection details
Under the Name column, click one of the listed detection names to view more details. In the Detection Details window, you can view the following information:
- Detection Name: Click the name to open a glossary explanation of the detection.
- Action Taken: The action that Malwarebytes took on the detection.
- Category: The protection that was triggered by the detection.
- Scanned At: The date and time the detection was scanned.
- Reported At: The time and date Malwarebytes reported the detection.
- Process Name: The file path of the process.
- Type: The type of detection, such as a file or outbound connection.
- Endpoint: Click the endpoint name to go to the Overview page for the endpoint.
- Domain: If the detection is a Malicious Website, this field shows the web url.
- Location: The location of the detection on the endpoint.
- Group Name: Click the name of the group to view the endpoints that belong to that group on the Endpoints screen.
- IP Address: If the detection is a Malicious Website, this field shows the website’s IP Address.
- Port: If the detection is a Malicious Website, this field shows the port the connection used.
Return to the Malwarebytes Cloud Platform Administrator Guide.
Source : Official Malwarebytes Brand
Editor by : BEST Antivirus KBS Team