

If your system is having high CPU usage or performance issues related to the real-time protection service in Microsoft Defender for Endpoint, you can submit a ticket to Microsoft support. Follow the steps in Collect Microsoft Defender Antivirus diagnostic data.
As an admin, you can also troubleshoot these issues on your own.
First, you might want to check if the issue is being caused by another software. Read Check with vendor for antivirus exclusions.
Otherwise, you can identify which software is related to the identified performance issue by following the steps in Analyze the Microsoft Protection Log.
You can also provide additional logs to your submission to Microsoft support by following the steps in:
- Capture process logs using Process Monitor
- Capture performance logs using Windows Performance Recorder
Check with vendor for antivirus exclusions
If you can readily identify the software affecting system performance, go to the software vendor’s knowledge base or support center. Search if they have recommendations about antivirus exclusions. If the vendor’s website does not have them, you can open a support ticket with them and ask them to publish one.
We recommend that software vendors follow the various guidelines in Partnering with the industry to minimize false positives. The vendor can submit their software through the Microsoft Security Intelligence portal.
Analyze the Microsoft Protection Log
In MPLog-xxxxxxxx-xxxxxx.log, you can find the estimated performance impact information of running software as EstimatedImpact:
Per-process counts:ProcessImageName: smsswd.exe, TotalTime: 6597, Count: 1406, MaxTime: 609, MaxTimeFile: \Device\HarddiskVolume3\_SMSTaskSequence\Packages\WQ1008E9\Files\FramePkg.exe, EstimatedImpact: 65%
| Field name | Description |
|---|---|
| ProcessImageName | Process image name |
| TotalTime | The cumulative duration in milliseconds spent in scans of files accessed by this process |
| Count | The number of scanned files accessed by this process |
| MaxTime | The duration in milliseconds in the longest single scan of a file accessed by this process |
| MaxTimeFile | The path of the file accessed by this process for which the longest scan of MaxTime duration was recorded |
| EstimatedImpact | The percentage of time spent in scans for files accessed by this process out of the period in which this process experienced scan activity |
If the performance impact is high, try adding the process to the Path/Process exclusions by following the steps in Configure and validate exclusions for Microsoft Defender Antivirus scans.
If the previous step doesn’t solve the problem, you can collect more information through the Process Monitor or the Windows Performance Recorder in the following sections.
Capture process logs using Process Monitor
Process Monitor (ProcMon) is an advanced monitoring tool that can show real-time processes. You can use this to capture the performance issue as it is occurring.
- Download Process Monitor v3.60 to a folder like
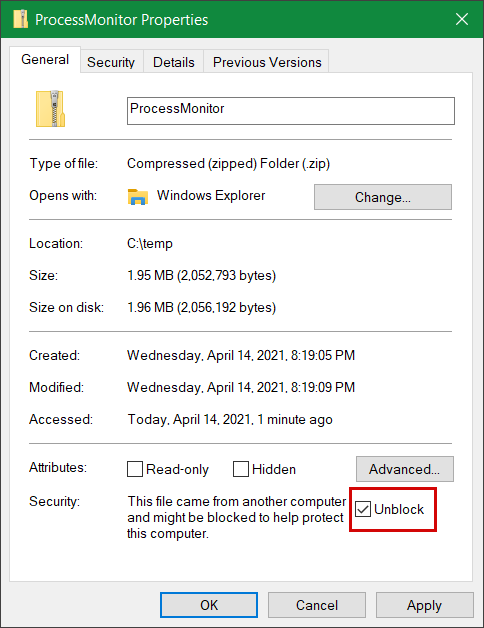
C:\temp. - To remove the file’s mark of the web:
- Right-click ProcessMonitor.zip and select Properties.
- Under the General tab, look for Security.
- Check the box beside Unblock.
- Select Apply.
- Unzip the file in
C:\tempso that the folder path will beC:\temp\ProcessMonitor. - Copy ProcMon.exe to the Windows client or Windows server you’re troubleshooting.
- Before running ProcMon, make sure all other applications not related to the high CPU usage issue are closed. Doing this will minimize the number of processes to check.
- You can launch ProcMon in two ways.
- Right-click ProcMon.exe and select Run as administrator.
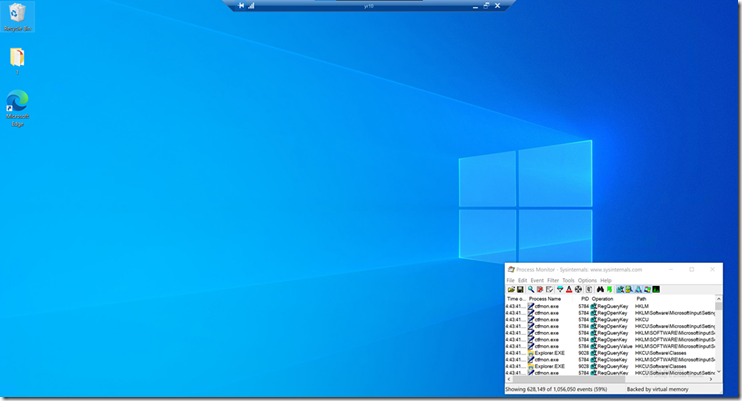
Since logging starts automatically, select the magnifying glass icon to stop the current capture or use the keyboard shortcut Ctrl+E.
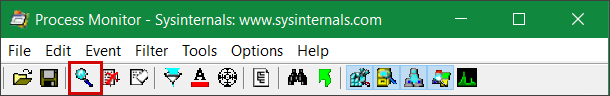
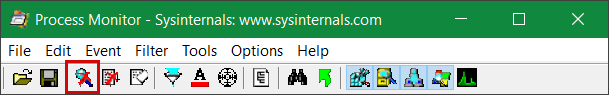
To verify that you have stopped the capture, check if the magnifying glass icon now appears with a red X.
Next, to clear the earlier capture, select the eraser icon.
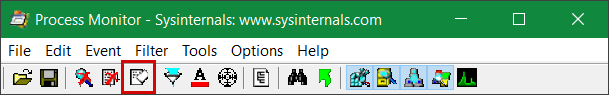
Or use the keyboard shortcut Ctrl+X.
- The second way is to run the command line as admin, then from the Process Monitor path, run:
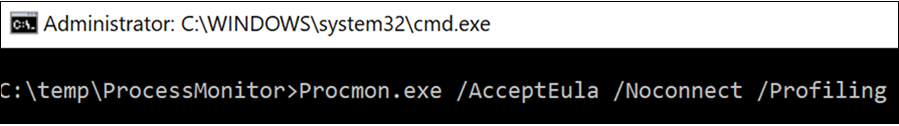 Console
Procmon.exe /AcceptEula /Noconnect /ProfilingTip
Make the ProcMon window as small as possible when capturing data so you can easily start and stop the trace.
- Right-click ProcMon.exe and select Run as administrator.
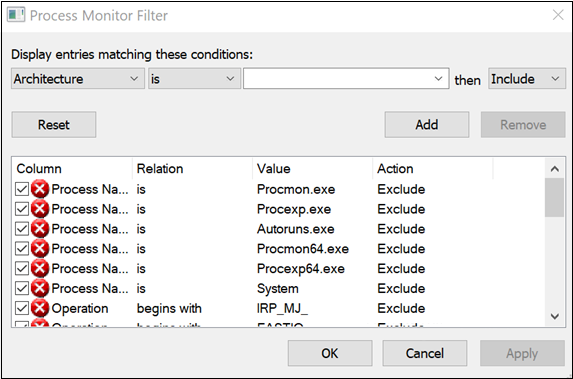
- After following one of the procedures in step 6, you’ll next see an option to set filters. Select OK. You can always filter the results after the capture is completed.
- To start the capture, select the magnifying glass icon again.
- Reproduce the problem.
Tip
Wait for the problem to be fully reproduced, then take note of the timestamp when the trace started.
- Once you have two to four minutes of process activity during the high CPU usage condition, stop the capture by selecting the magnifying glass icon.
- To save the capture with a unique name and with the .pml format, select File then select Save…. Make sure to select the radio buttons All events and Native Process Monitor Format (PML).
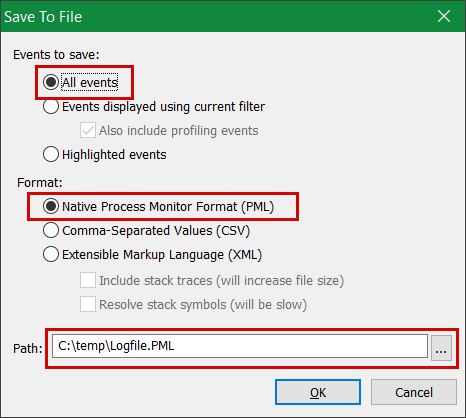
- For better tracking, change the default path from
C:\temp\ProcessMonitor\LogFile.PMLtoC:\temp\ProcessMonitor\%ComputerName%_LogFile_MMDDYEAR_Repro_of_issue.PMLwhere:%ComputerName%is the device nameMMDDYEARis the month, day, and yearRepro_of_issueis the name of the issue you’re trying to reproduce
Tip
If you have a working system, you might want to get a sample log to compare.
- Zip the .pml file and submit it to Microsoft support.
Capture performance logs using Windows Performance Recorder
You can use Windows Performance Recorder (WPR) to include additional information in your submission to Microsoft support. WPR is a powerful recording tool that creates Event Tracing for Windows recordings.
WPR is part of the Windows Assessment and Deployment Kit (Windows ADK) and can be downloaded from Download and install the Windows ADK. You can also download it as part of the Windows 10 Software Development Kit at Windows 10 SDK.
You can use the WPR user interface by following the steps in Capture performance logs using the WPR UI.
Alternatively, you can also use the command-line tool wpr.exe, which is available in Windows 8 and later versions by following the steps in Capture performance logs using the WPR CLI.
Capture performance logs using the WPR UI
Tip
If multiple devices are experiencing this issue, use the one which has the most RAM.
- Download and install WPR.
- Under Windows Kits, right-click Windows Performance Recorder.
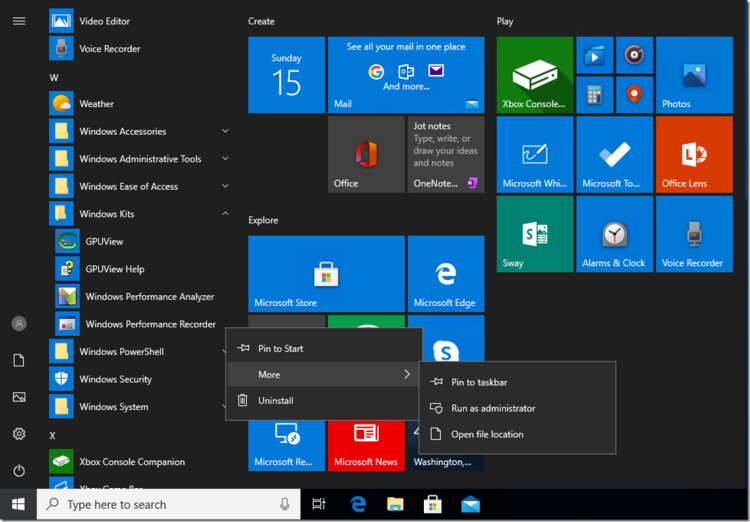
Select More. Select Run as administrator.
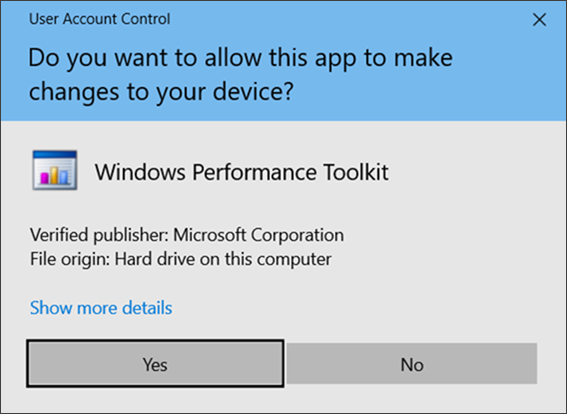
- When the User Account Control dialog box appears, select Yes.
- Next, download the Microsoft Defender for Endpoint analysis profile and save as
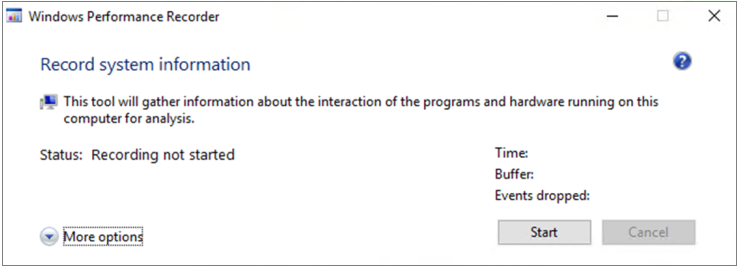
MDAV.wprpto a folder likeC:\temp. - On the WPR dialog box, select More options.
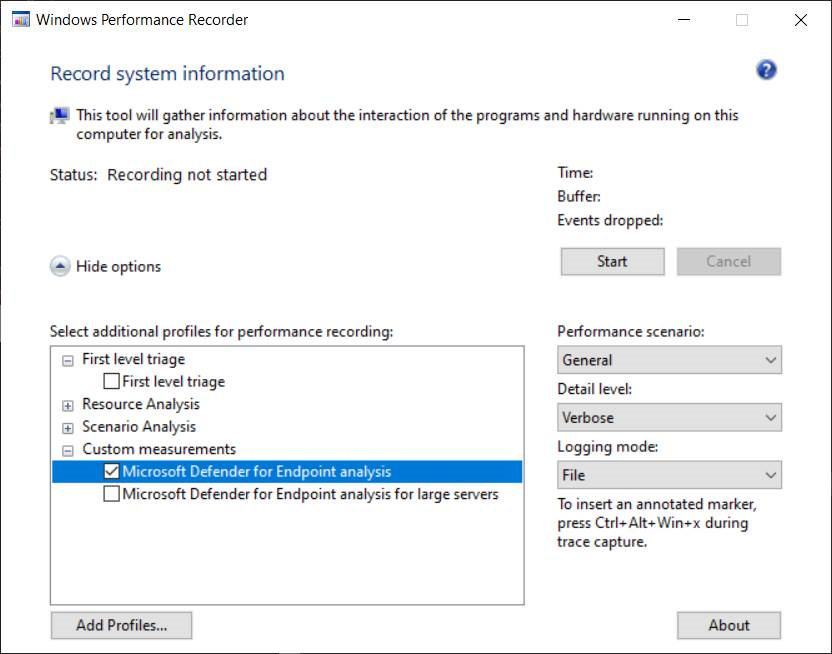
- Select Add Profiles… and browse to the path of the
MDAV.wprpfile. - After that, you should see a new profile set under Custom measurements named Microsoft Defender for Endpoint analysis underneath it.
Warning
If your Windows Server has 64 GB of RAM or more, use the custom measurement
Microsoft Defender for Endpoint analysis for large serversinstead ofMicrosoft Defender for Endpoint analysis. Otherwise, your system could consume a high amount of non-paged pool memory or buffers which can lead to system instability. You can choose which profiles to add by expanding Resource Analysis. This custom profile provides the necessary context for in-depth performance analysis. - To use the custom measurement Microsoft Defender for Endpoint verbose analysis profile in the WPR UI:
- Ensure no profiles are selected under the First-level triage, Resource Analysis and Scenario Analysis groups.
- Select Custom measurements.
- Select Microsoft Defender for Endpoint analysis.
- Select Verbose under Detail level.
- Select File or Memory under Logging mode.
Important
You should select File to use the file logging mode if the performance issue can be reproduced directly by the user. Most issues fall under this category. However, if the user cannot directly reproduce the issue but can easily notice it once the issue occurs, the user should select Memory to use the memory logging mode. This ensures that the trace log will not inflate excessively due to the long run time.
- Now you’re ready to collect data. Exit all the applications that are not relevant to reproducing the performance issue. You can select Hide options to keep the space occupied by the WPR window small.
Tip
Try starting the trace at whole number seconds. For instance, 01:30:00. This will make it easier to analyze the data. Also try to keep track of the timestamp of exactly when the issue is reproduced.
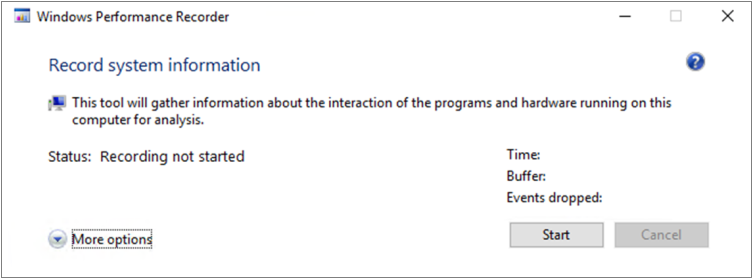
- Select Start.
- Reproduce the issue.
Tip
Keep the data collection to no more than five minutes. Two to three minutes is a good range since a lot of data is being collected.
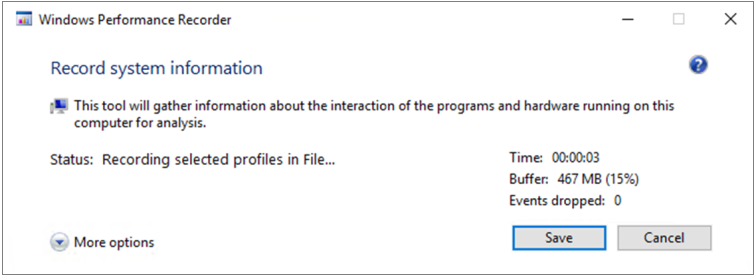
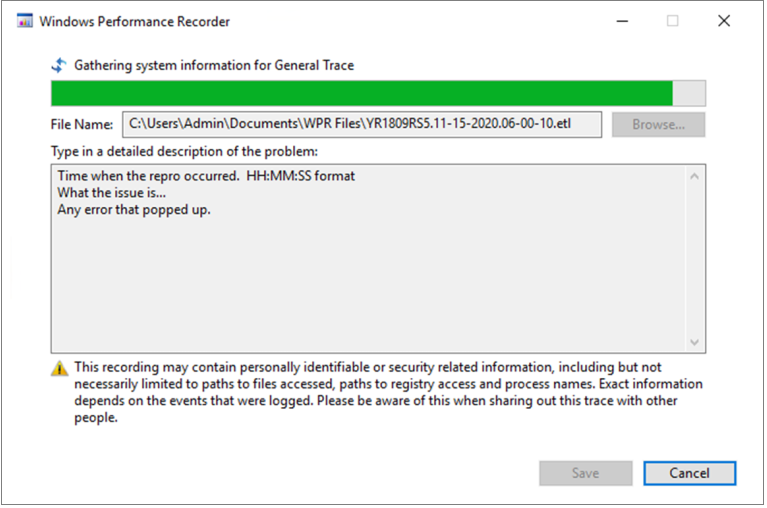
- Select Save.
- Fill up Type in a detailed description of the problem: with information about the problem and how you reproduced the issue.
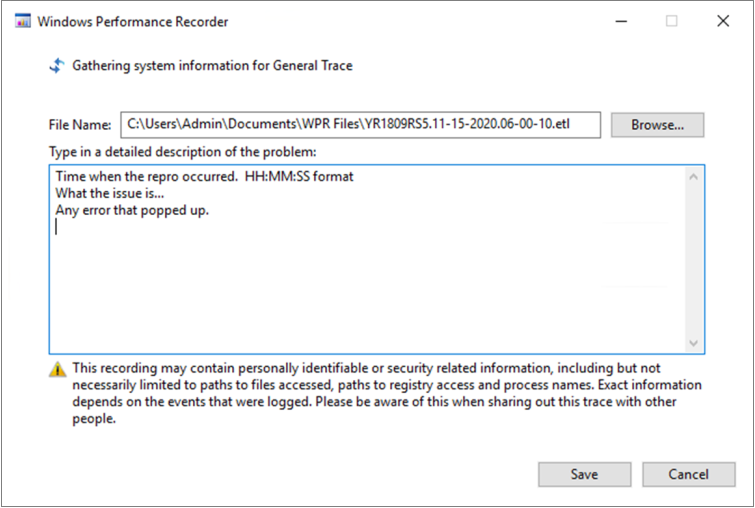
- Select File Name: to determine where your trace file will be saved. By default, it is saved to
%user%\Documents\WPR Files\. - Select Save.
- Select File Name: to determine where your trace file will be saved. By default, it is saved to
- Wait while the trace is being merged.
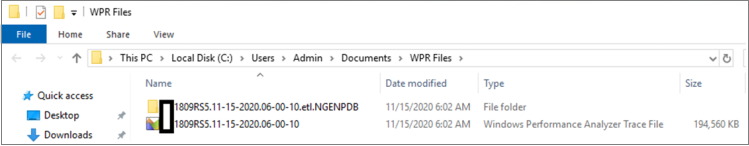
- Once the trace is saved, select Open folder.
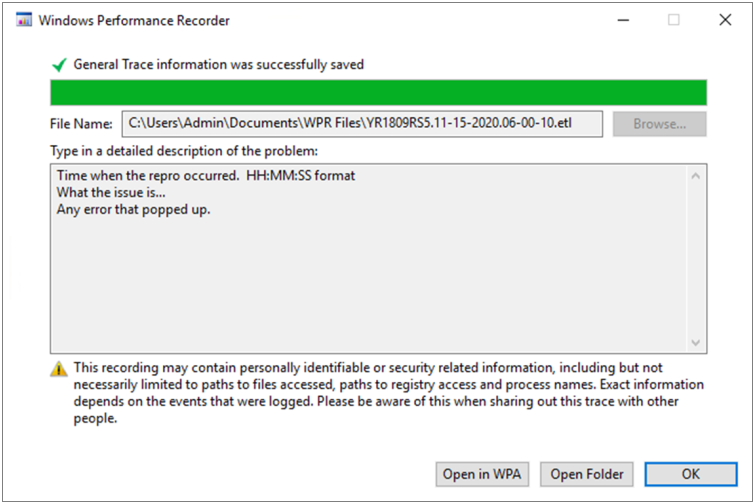
Include both the file and the folder in your submission to Microsoft Support.
Capture performance logs using the WPR CLI
The command-line tool wpr.exe is part of the operating system starting with Windows 8. To collect a WPR trace using the command-line tool wpr.exe:
- Download Microsoft Defender for Endpoint analysis profile for performance traces to a file named
MDAV.wprpin a local directory such asC:\traces. - Right-click the Start Menu icon and select Windows PowerShell (Admin) or Command Prompt (Admin) to open an Admin command prompt window.
- When the User Account Control dialog box appears, select Yes.
- At the elevated prompt, run the following command to start a Microsoft Defender for Endpoint performance trace:
Console
wpr.exe -start C:\traces\MDAV.wprp!WD.Verbose -filemodeWarning
If your Windows Server has 64 GB or RAM or more, use profiles
WDForLargeServers.LightandWDForLargeServers.Verboseinstead of profilesWD.LightandWD.Verbose, respectively. Otherwise, your system could consume a high amount of non-paged pool memory or buffers which can lead to system instability. - Reproduce the issue.
Tip
Keep the data collection no to more than five minutes. Depending on the scenario, two to three minutes is a good range since a lot of data is being collected.
- At the elevated prompt, run the following command to stop the performance trace, making sure to provide information about the problem and how you reproduced the issue:
Console
wpr.exe -stop merged.etl "Timestamp when the issue was reproduced, in HH:MM:SS format" "Description of the issue" "Any error that popped up" - Wait until the trace is merged.
- Include both the file and the folder in your submission to Microsoft support.