

This topic provides some general steps that can be used to narrow down performance issues related to Microsoft Defender for Endpoint on macOS.
Real-time protection (RTP) is a feature of Microsoft Defender for Endpoint on macOS that continuously monitors and protects your device against threats. It consists of file and process monitoring and other heuristics.
Depending on the applications that you’re running and your device characteristics, you may experience suboptimal performance when running Microsoft Defender for Endpoint on macOS. In particular, applications or system processes that access many resources over a short timespan can lead to performance issues in Microsoft Defender for Endpoint on macOS.
The following steps can be used to troubleshoot and mitigate these issues:
- Disable real-time protection using one of the following methods and observe whether the performance improves. This approach helps narrow down whether Microsoft Defender for Endpoint on macOS is contributing to the performance issues.
If your device is not managed by your organization, real-time protection can be disabled using one of the following options:
- From the user interface. Open Microsoft Defender for Endpoint on macOS and navigate to Manage settings.
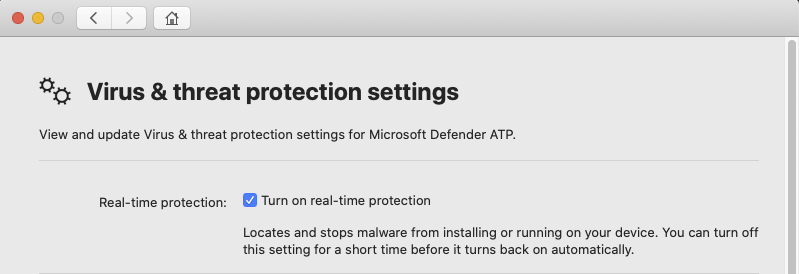
- From the Terminal. For security purposes, this operation requires elevation.
Bash
mdatp config real-time-protection --value disabledIf your device is managed by your organization, real-time protection can be disabled by your administrator using the instructions in Set preferences for Microsoft Defender for Endpoint on macOS.
If the performance problem persists while real-time protection is off, the origin of the problem could be the endpoint detection and response component. In this case, please contact customer support for further instructions and mitigation.
- From the user interface. Open Microsoft Defender for Endpoint on macOS and navigate to Manage settings.
- Open Finder and navigate to Applications > Utilities. Open Activity Monitor and analyze which applications are using the resources on your system. Typical examples include software updaters and compilers.
- To find the applications that are triggering the most scans, you can use real-time statistics gathered by Defender for Endpoint on Mac.
Note
This feature is available in version 100.90.70 or newer. This feature is enabled by default on the Dogfood and InsiderFast channels. If you’re using a different update channel, this feature can be enabled from the command line:
Bashmdatp config real-time-protection-statistics --value enabledThis feature requires real-time protection to be enabled. To check the status of real-time protection, run the following command:
Bashmdatp health --field real_time_protection_enabledVerify that the real_time_protection_enabled entry is true. Otherwise, run the following command to enable it:
Bashmdatp config real-time-protection --value enabledOutputConfiguration property updatedTo collect current statistics, run:
Bashmdatp diagnostic real-time-protection-statistics --output json > real_time_protection.jsonNote
Using –output json (note the double dash) ensures that the output format is ready for parsing. The output of this command will show all processes and their associated scan activity.
- On your Mac system, download the sample Python parser high_cpu_parser.py using the command:
Bash
curl -O https://raw.githubusercontent.com/microsoft/mdatp-xplat/master/linux/diagnostic/high_cpu_parser.pyThe output of this command should be similar to the following:
Output--2020-11-14 11:27:27-- https://raw.githubusercontent.com/microsoft. mdatp-xplat/master/linus/diagnostic/high_cpu_parser.py Resolving raw.githubusercontent.com (raw.githubusercontent.com)... 151.101.xxx.xxx Connecting to raw.githubusercontent.com (raw.githubusercontent.com)| 151.101.xxx.xxx| :443... connected. HTTP request sent, awaiting response... 200 OK Length: 1020 [text/plain] Saving to: 'high_cpu_parser.py' 100%[===========================================>] 1,020 --.-K/s in 0s - Next, type the following commands:
Bash
chmod +x high_cpu_parser.pyBashcat real_time_protection.json | python high_cpu_parser.py > real_time_protection.logThe output of the above is a list of the top contributors to performance issues. The first column is the process identifier (PID), the second column is te process name, and the last column is the number of scanned files, sorted by impact.
For example, the output of the command will be something like the below:
Output... > python ~/repo/mdatp-xplat/linux/diagnostic/high_cpu_parser.py <~Downloads/output.json | head -n 10 27432 None 76703 73467 actool 1249 73914 xcodebuild 1081 73873 bash 1050 27475 None 836 1 launchd 407 73468 ibtool 344 549 telemetryd_v1 325 4764 None 228 125 CrashPlanService 164To improve the performance of Defender for Endpoint on Mac, locate the one with the highest number under the Total files scanned row and add an exclusion for it. For more information, see Configure and validate exclusions for Defender for Endpoint on Linux.
Note
The application stores statistics in memory and only keeps track of file activity since it was started and real-time protection was enabled. Processes that were launched before or during periods when real time protection was off are not counted. Additionally, only events which triggered scans are counted.
- Configure Microsoft Defender for Endpoint on macOS with exclusions for the processes or disk locations that contribute to the performance issues and re-enable real-time protection.
See Configure and validate exclusions for Microsoft Defender for Endpoint on macOS for details.