

Running the analyzer through GUI scenario
- Download the XMDE Client Analyzer tool to the macOS or Linux machine you need to investigate.
Note
The current SHA256 hash of ‘XMDEClientAnalyzer.zip’ that is downloaded from the above link is: ’34C7F043211575544BB2C9CE30AB0998172066E44CD51E1CA018EDE9C96AB834′.
- Extract the contents of XMDEClientAnalyzer.zip on the machine.
- Open a terminal session, change directory to the extracted location and run:
./mde_support_tool.sh -dNote
On Linux, if the script does not have permissions to execute, then you’ll need to first run:
chmod a+x mde_support_tool.sh
Running the analyzer using a terminal or SSH scenario
Open a terminal or SSH into the relevant machine and run the following commands:
wget --quiet -O XMDEClientAnalyzer.zip https://aka.ms/XMDEClientAnalyzerunzip -q XMDEClientAnalyzer.zipcd XMDEClientAnalyzerchmod +x mde_support_tool.sh- Run as non-root use to install required pip and lxml which components:
./mde_support_tool.sh - To collect actual diagnostic package and generate the result archive file run again as root:
./mde_support_tool.sh -d
Note
- For Linux, the analyzer requires ‘lxml’ to produce the result output. If not installed, the analyzer will try to fetch it from the official repository for python packages below: https://files.pythonhosted.org/packages/\*/lxml\*.whl
- In addition, the tool currently requires Python version 3 or later to be installed.
- If you are running on a machine that cannot use Python 3 or fetch the lxml component, then you can download a binary based version of the analyzer that does not have any of the requirements: XMDE Client Analyzer Binary
- If your device is behind a proxy, then you can simply pass the proxy server as an environment variable to the mde_support_tool.sh script. For example:
https_proxy=https://myproxy.contoso.com:8080 ./mde_support_tool.sh"
Example:
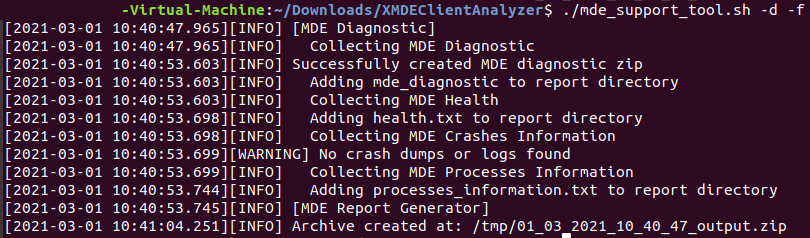
Additional syntax help:
-h # Help
# Show help message
performance # Performance
# Collects extensive tracing for analysis of a performance issue that can be reproduced on demand. Using --length=<seconds> to specify the duration of the benchmark.
-o # Output
# Specify the destination path for the result file
-nz # No-Zip
# If set, a directory will be created instead of a resulting archive file
-f # Force
# Overwrite if output already exists in destination path
Result package contents on macOS and Linux
- report.html
Description: The main HTML output file that will contain the findings and guidance that the analyzer script run on the machine can produce.
- mde_diagnostic.zip
Description: Same diagnostic output that gets generated when running mdatp diagnostic create on either macOS
or
- mde.xml
Description: XML output that is generated while running and is used to build the html report file.
- Processes_information.txt
Description: contains the details of the running Microsoft Defender for Endpoint related processes on the system.
- Log.txt
Description: contains the same log messages written on screen during the data collection.
- Health.txt
Description: The same basic health output that is shown when running mdatp health command.
- Events.xml
Description: Additional XML file used by the analyzer when building the HTML report.
- Auditd_info.txt
Description: details on auditd service and related components for Linux OS
- perf_benchmark.tar.gz
Description: The performance test reports. You will see this only if you are using the performance parameter.