The alert page in Microsoft Defender for Endpoint provides full context to the alert, by combining attack signals and alerts related to the selected alert, to construct a detailed alert story.
Quickly triage, investigate, and take effective action on alerts that affect your organization. Understand why they were triggered, and their impact from one location. Learn more in this overview.
Getting started with an alert
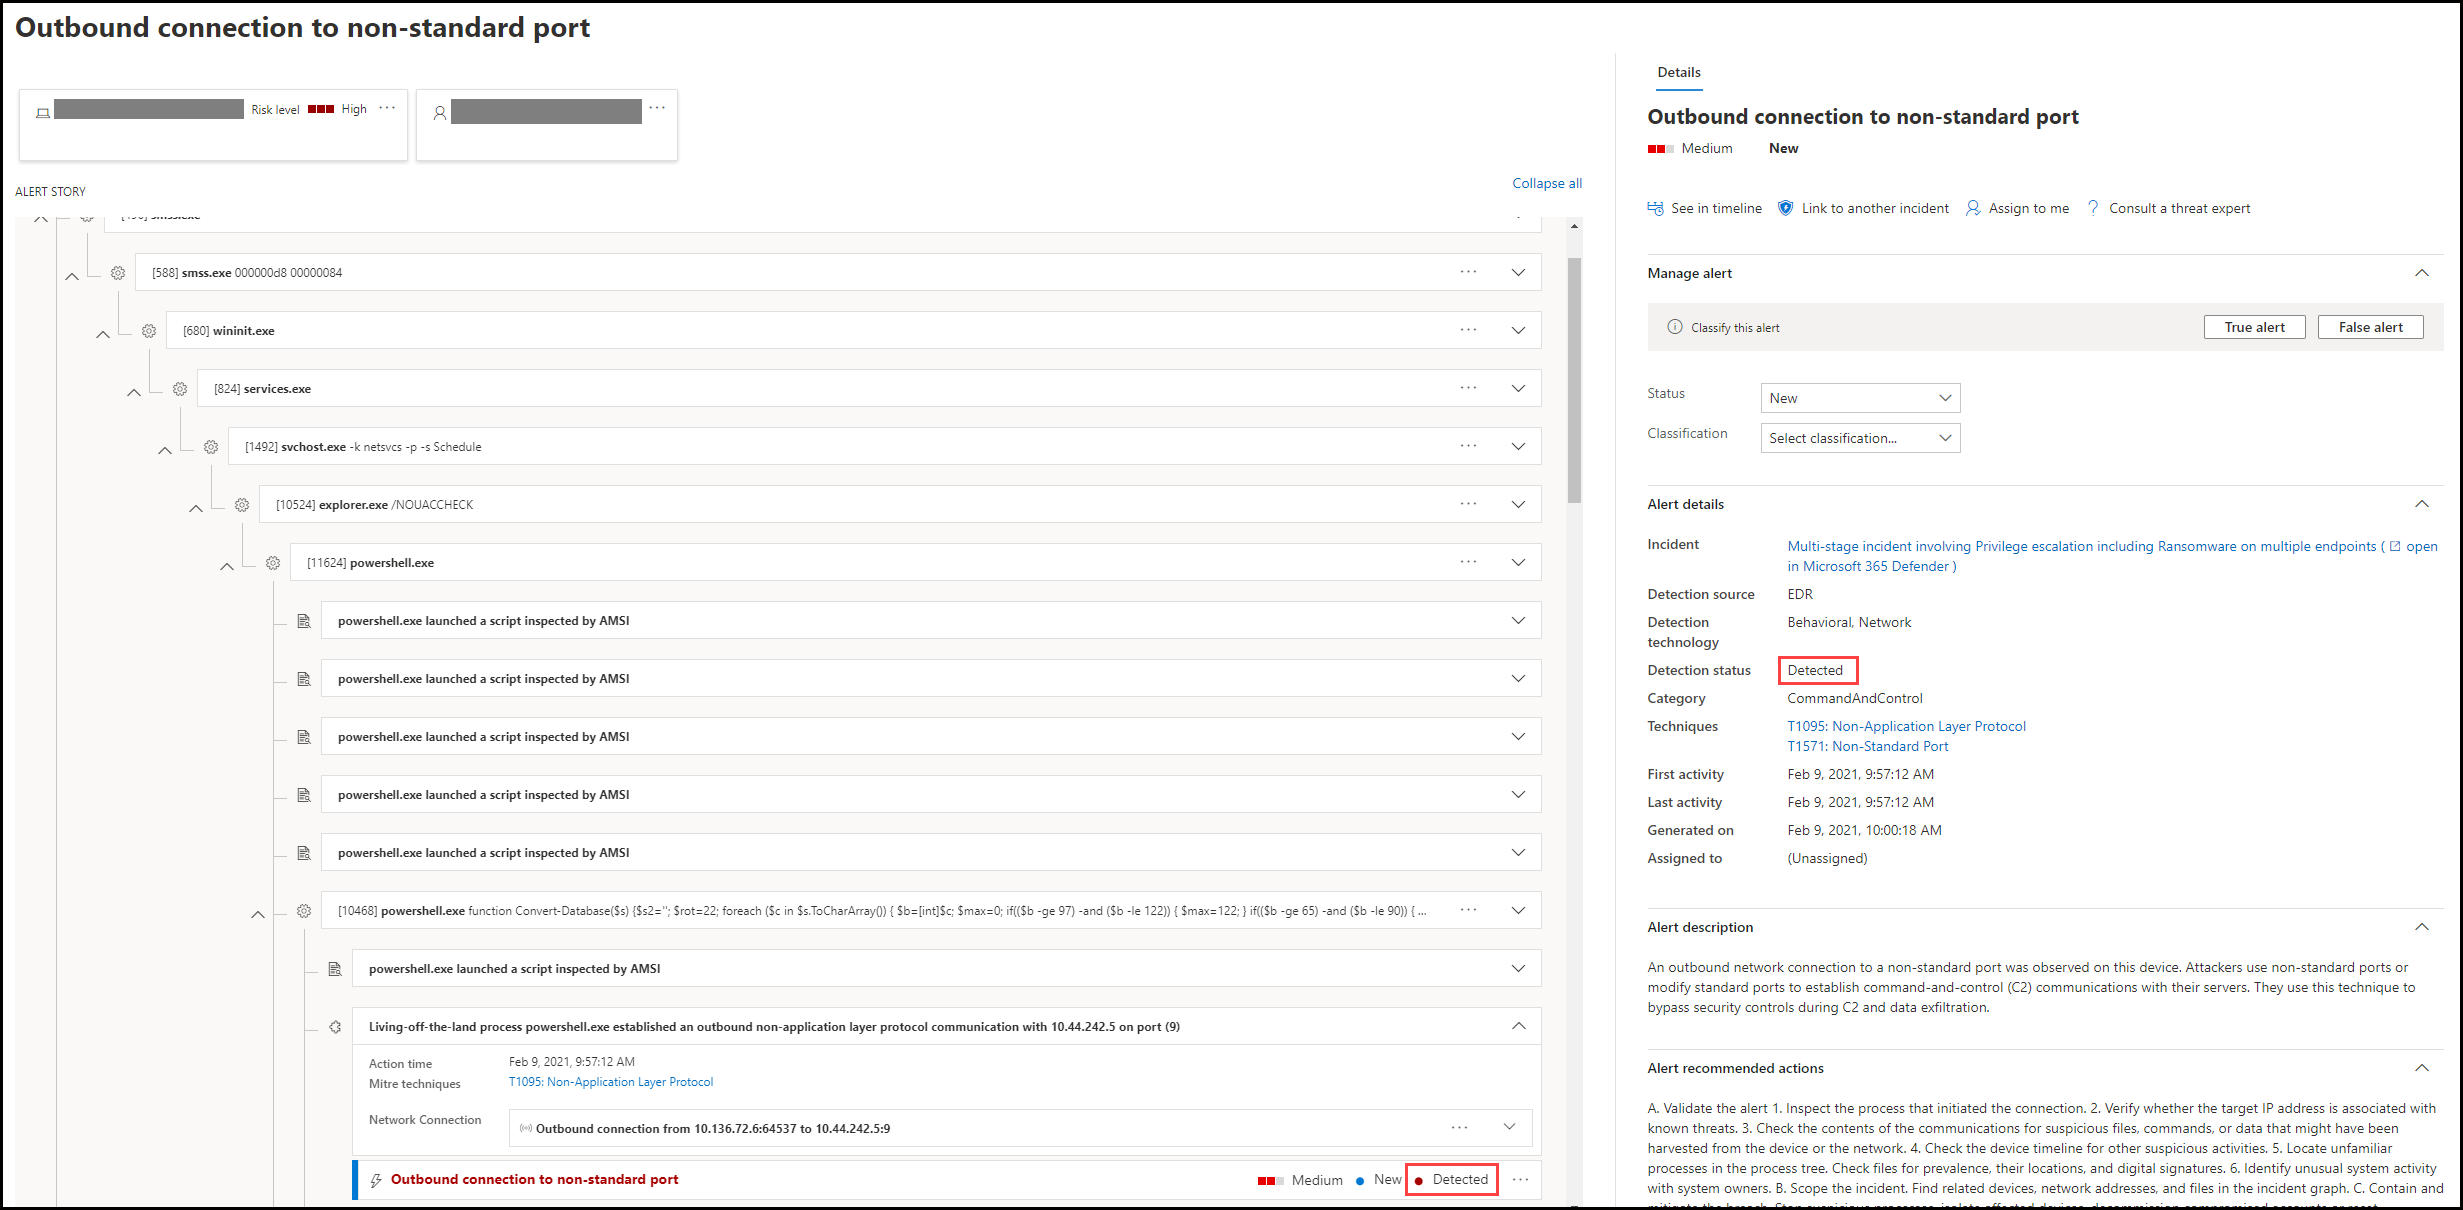
Selecting an alert’s name in Defender for Endpoint will land you on its alert page. On the alert page, all the information will be shown in context of the selected alert. Each alert page consists of 4 sections:
- The alert title shows the alert’s name and is there to remind you which alert started your current investigation regardless of what you have selected on the page.
- Affected assets lists cards of devices and users affected by this alert that are clickable for further information and actions.
- The alert story displays all entities related to the alert, interconnected by a tree view. The alert in the title will be the one in focus when you first land on your selected alert’s page. Entities in the alert story are expandable and clickable, to provide additional information and expedite response by allowing you to take actions right in the context of the alert page. Use the alert story to start your investigation. Learn how in Investigate alerts in Microsoft Defender for Endpoint.
- The details pane will show the details of the selected alert at first, with details and actions related to this alert. If you select any of the affected assets or entities in the alert story, the details pane will change to provide contextual information and actions for the selected object.
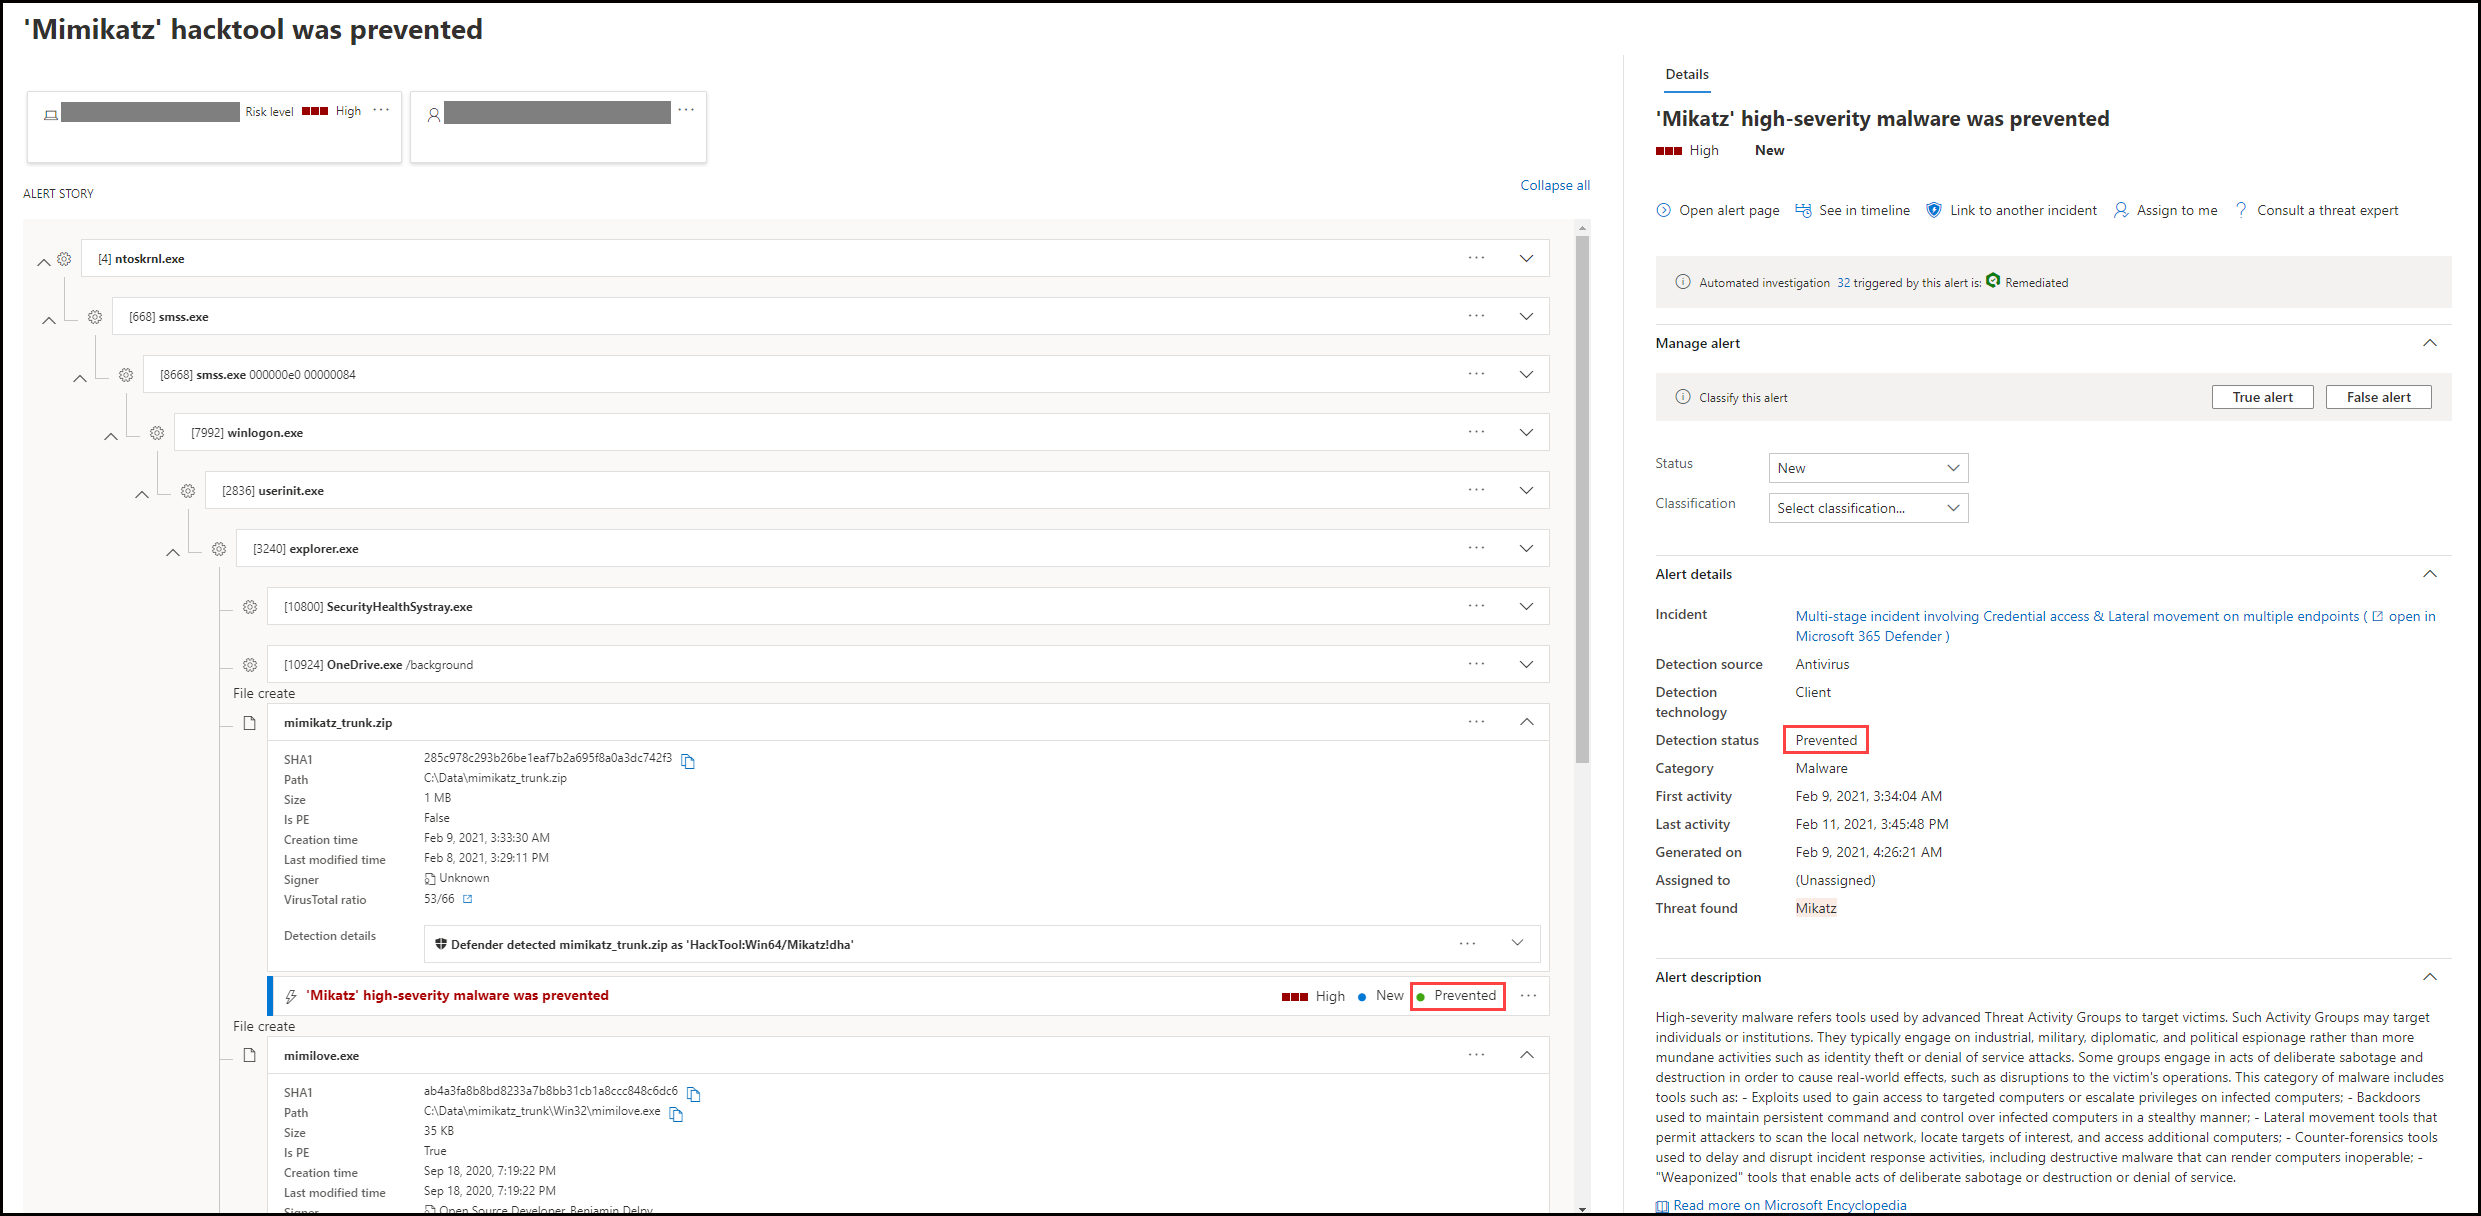
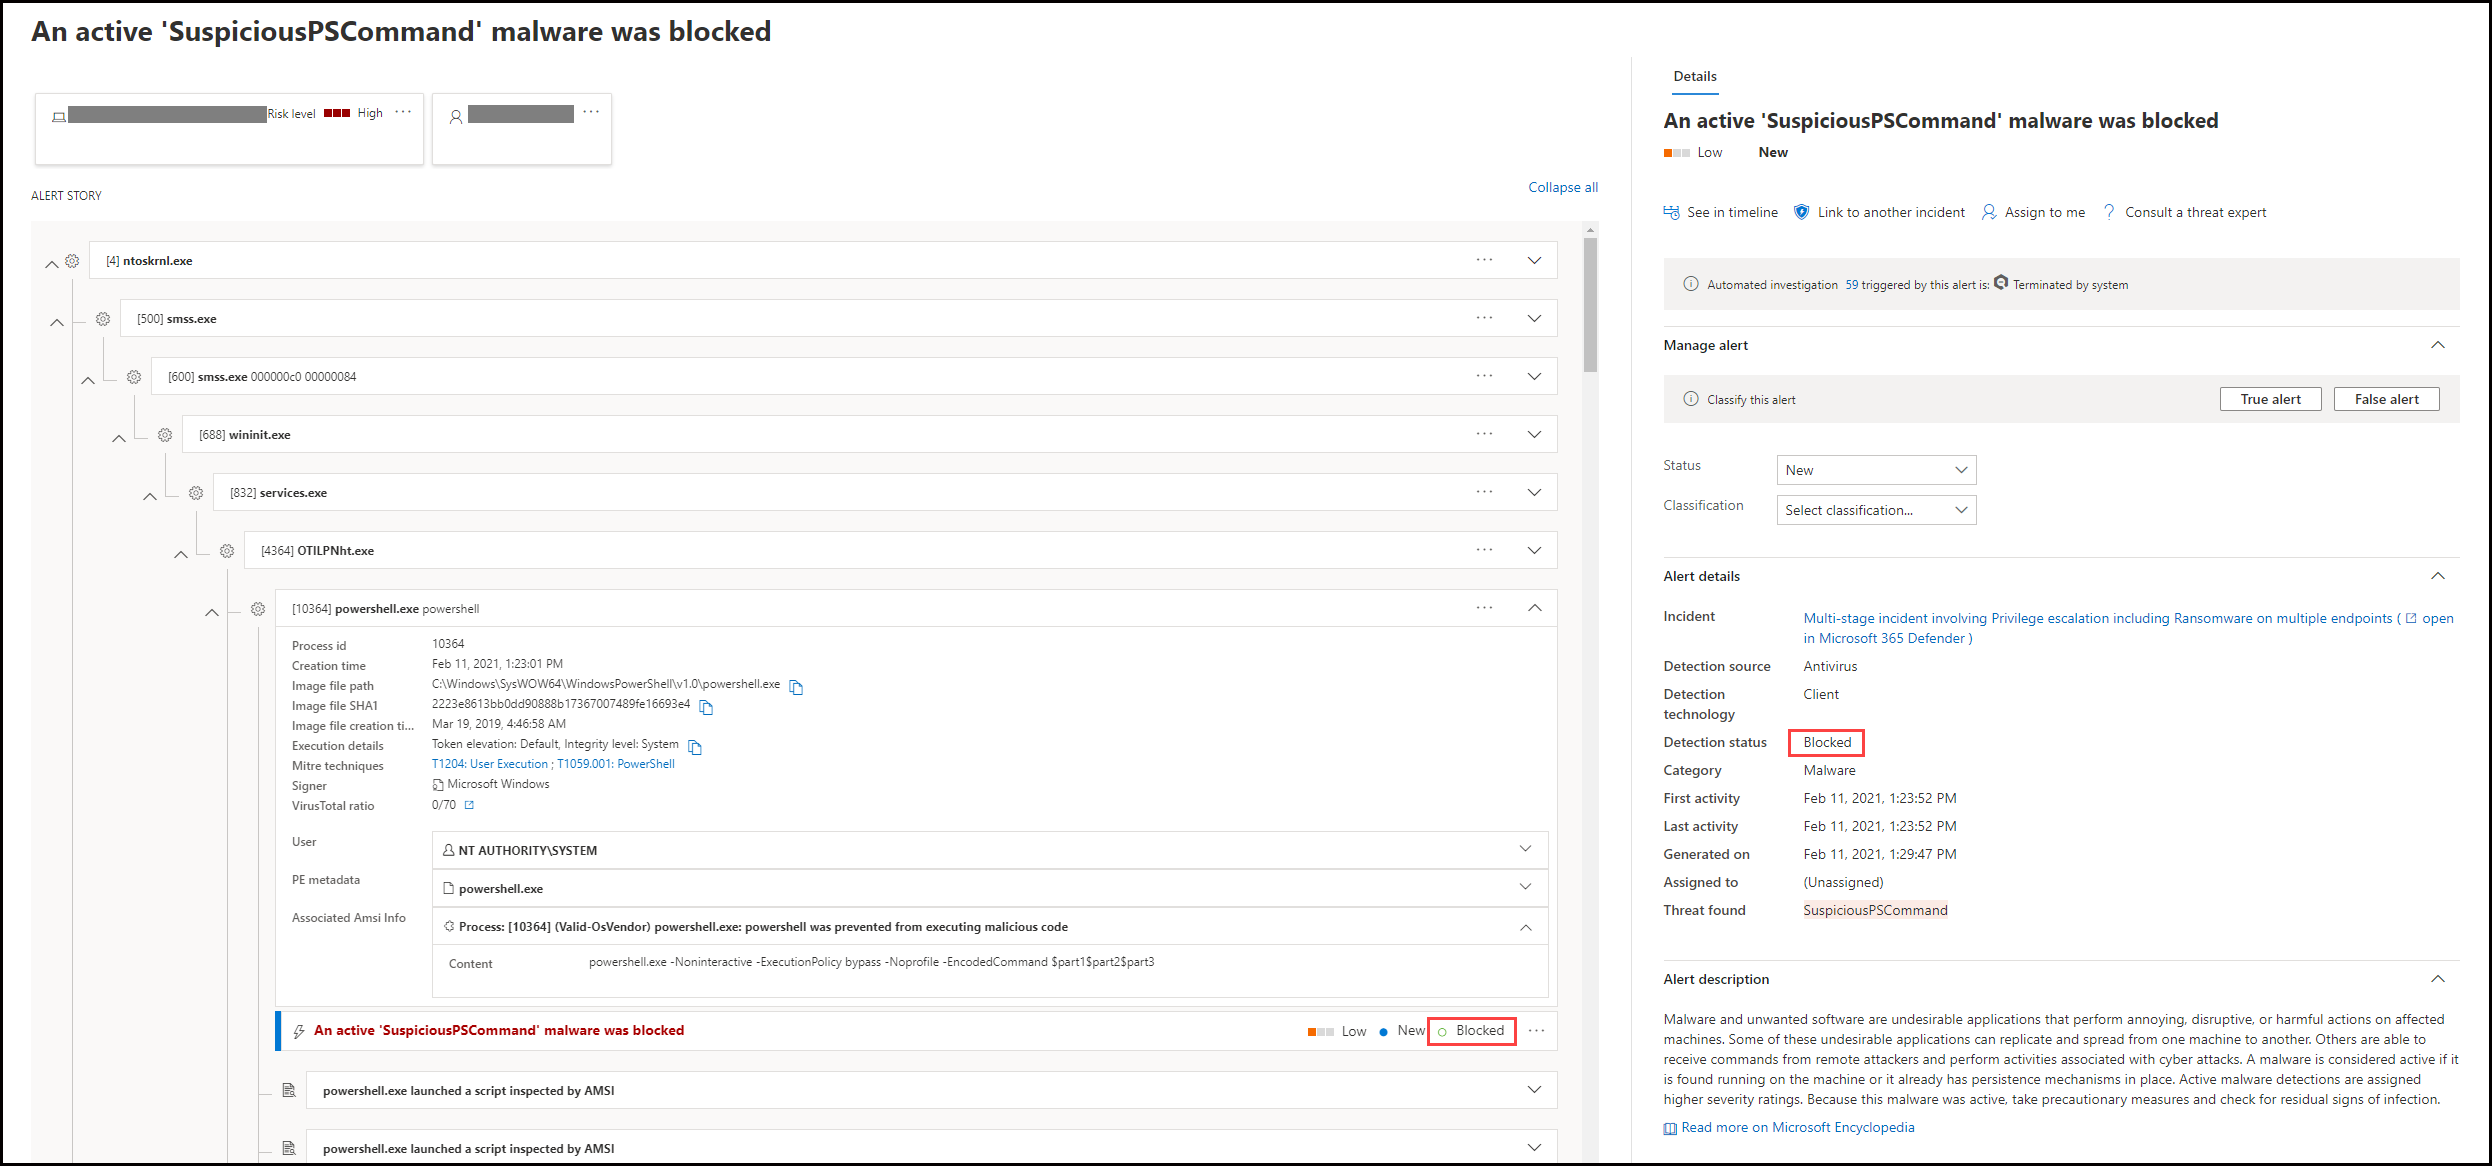
Note the detection status for your alert.
- Prevented: The attempted suspicious action was avoided. For example, a file either wasn’t written to disk or executed.
- Blocked: Suspicious behavior was executed and then blocked. For example, a process was executed but because it subsequently exhibited suspicious behaviors, the process was terminated.
- Detected: An attack was detected and is possibly still active.
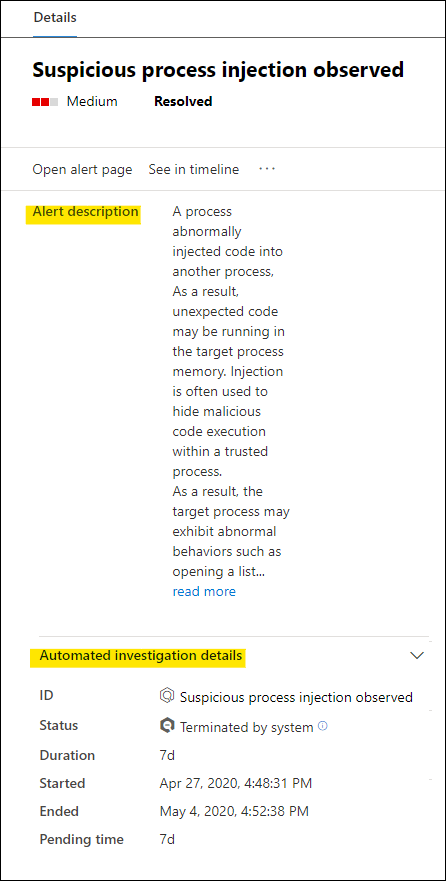
You can then also review the automated investigation details in your alert’s details pane, to see which actions were already taken, as well as reading the alert’s description for recommended actions.
Other information available in the details pane when the alert opens includes MITRE techniques, source, and additional contextual details.
Review affected assets
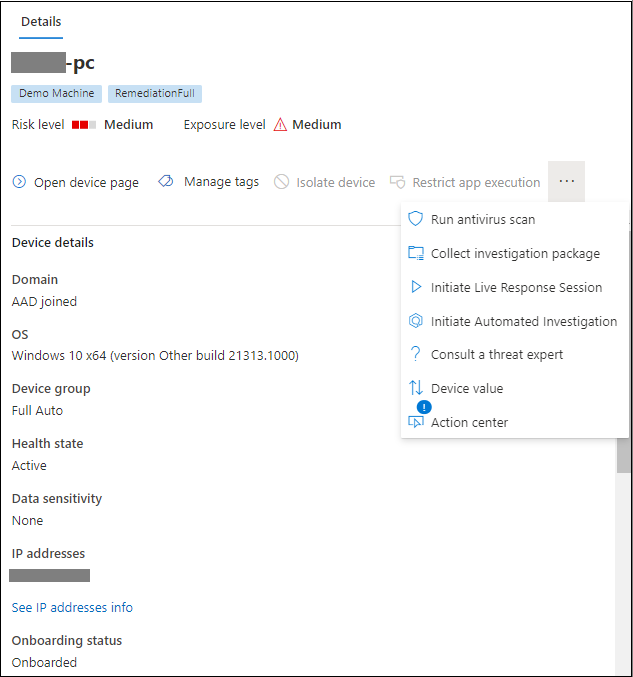
Selecting a device or a user card in the affected assets sections will switch to the details of the device or user in the details pane.
- For devices, the details pane will display information about the device itself, like Domain, Operating System, and IP. Active alerts and the logged on users on that device are also available. You can take immediate action by isolating the device, restricting app execution, or running an antivirus scan. Alternatively, you could collect an investigation package, initiate an automated investigation, or go to the device page to investigate from the device’s point of view.
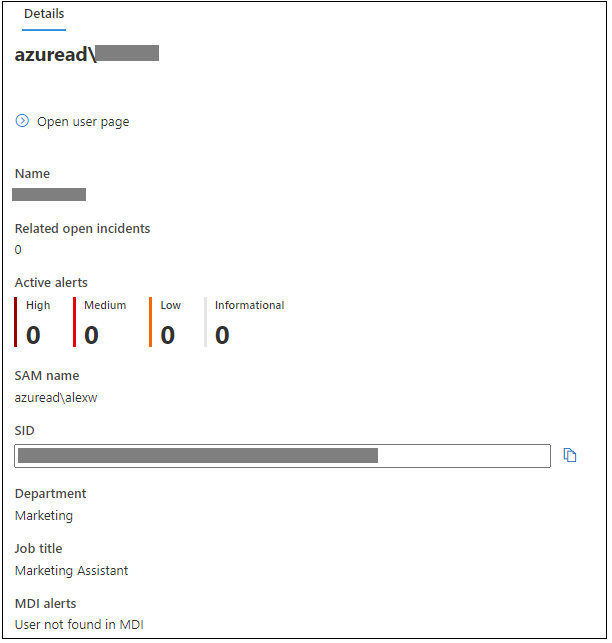
- For users, the details pane will display detailed user information, such as the user’s SAM name and SID, as well as logon types performed by this user and any alerts and incidents related to it. You can select Open user page to continue the investigation from that user’s point of view.